Fig. 18
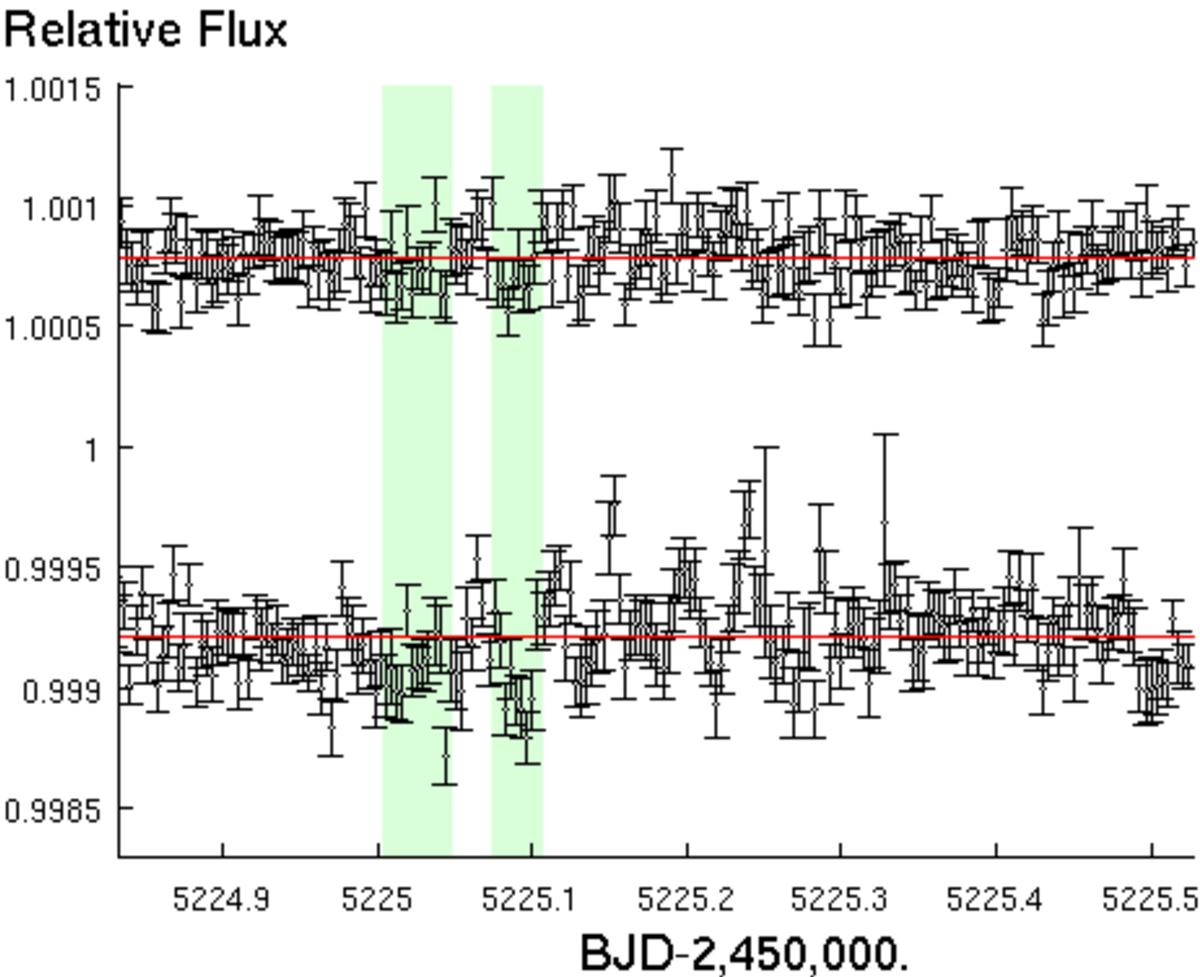
Highlight on the impact of the data reduction/analysis details on the presence of low-amplitude transit-shaped structures in the Spitzer photometry (2010 Jan. 28, AOR: 38702848). We apply relative flux offsets in the above two plots for clarity. The upper dataset is the result of aperture photometry with a 2D elliptical Gaussian centring while the lower one is done with a double 1D Gaussian fit. The upper is corrected with a baseline involving the measured FWHM while the lower is not. Black dots are the binned data per interval of 5 min with 1σ error bars. The supposed UCF-1.01 (right) and UCF-1.02 (left) transit events are shaded in green.
Current usage metrics show cumulative count of Article Views (full-text article views including HTML views, PDF and ePub downloads, according to the available data) and Abstracts Views on Vision4Press platform.
Data correspond to usage on the plateform after 2015. The current usage metrics is available 48-96 hours after online publication and is updated daily on week days.
Initial download of the metrics may take a while.