Fig. 8
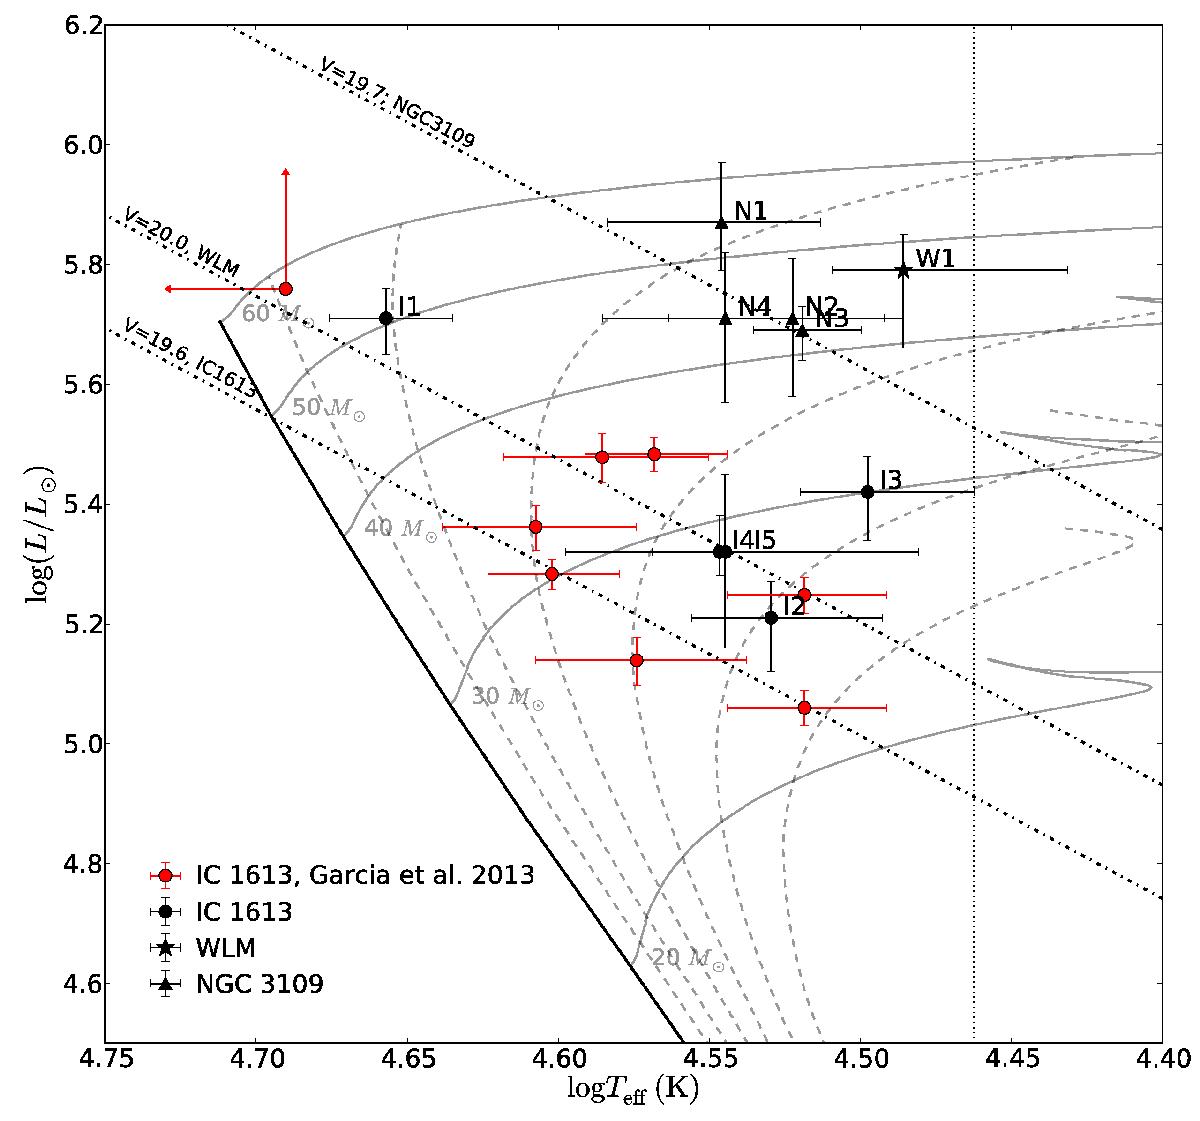
Hertzsprung-Russell diagram indicating the location of the target stars. Also plotted are evolutionary tracks from Brott et al. (2011) for SMC metallicity and no initial rotation. The dashed lines indicate isochrones in steps of 1 Myr. The dashed-dotted lines indicate the magnitude cut-offs for the three galaxies, and the dotted vertical line roughly indicates the division between O and B stars. The IC 1613 stars from Garcia & Herrero (2013) are plotted in red.
Current usage metrics show cumulative count of Article Views (full-text article views including HTML views, PDF and ePub downloads, according to the available data) and Abstracts Views on Vision4Press platform.
Data correspond to usage on the plateform after 2015. The current usage metrics is available 48-96 hours after online publication and is updated daily on week days.
Initial download of the metrics may take a while.