Fig. 5
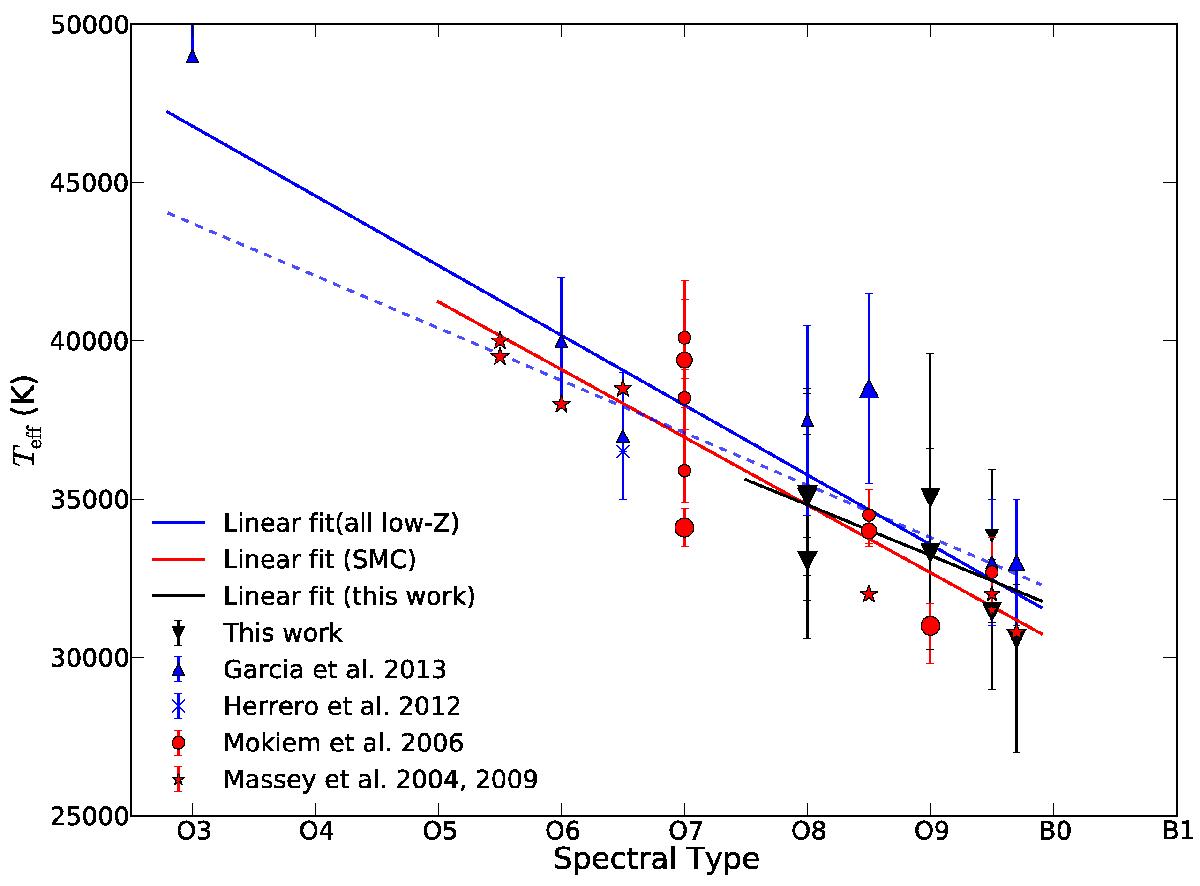
Spectral type versus effective temperature calibration for giants and supergiants in low-metallicity environments. Symbol size indicates the luminosity class, with the larger symbols for supergiants. Plotted are results from this work, the Herrero et al. (2012) and Garcia & Herrero (2013) results for IC 1613, and the Mokiem et al. (2006) and Massey et al. (2004, 2009) results for the SMC. The solid black line indicates a linear fit to the stars from this paper, not including the error bars on Teff. The red solid line is the unweighted linear fit to the SMC stars, and the blue solid line the fit to the stars in IC 1613, WLM and NGC 3109 (low-Z). The dashed blue line is an unweighted fit to all low-Z results but excluding the single O3 giant. It illustrates the sensitivity of the found relation to this point.
Current usage metrics show cumulative count of Article Views (full-text article views including HTML views, PDF and ePub downloads, according to the available data) and Abstracts Views on Vision4Press platform.
Data correspond to usage on the plateform after 2015. The current usage metrics is available 48-96 hours after online publication and is updated daily on week days.
Initial download of the metrics may take a while.