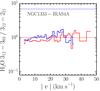
Fig. 9
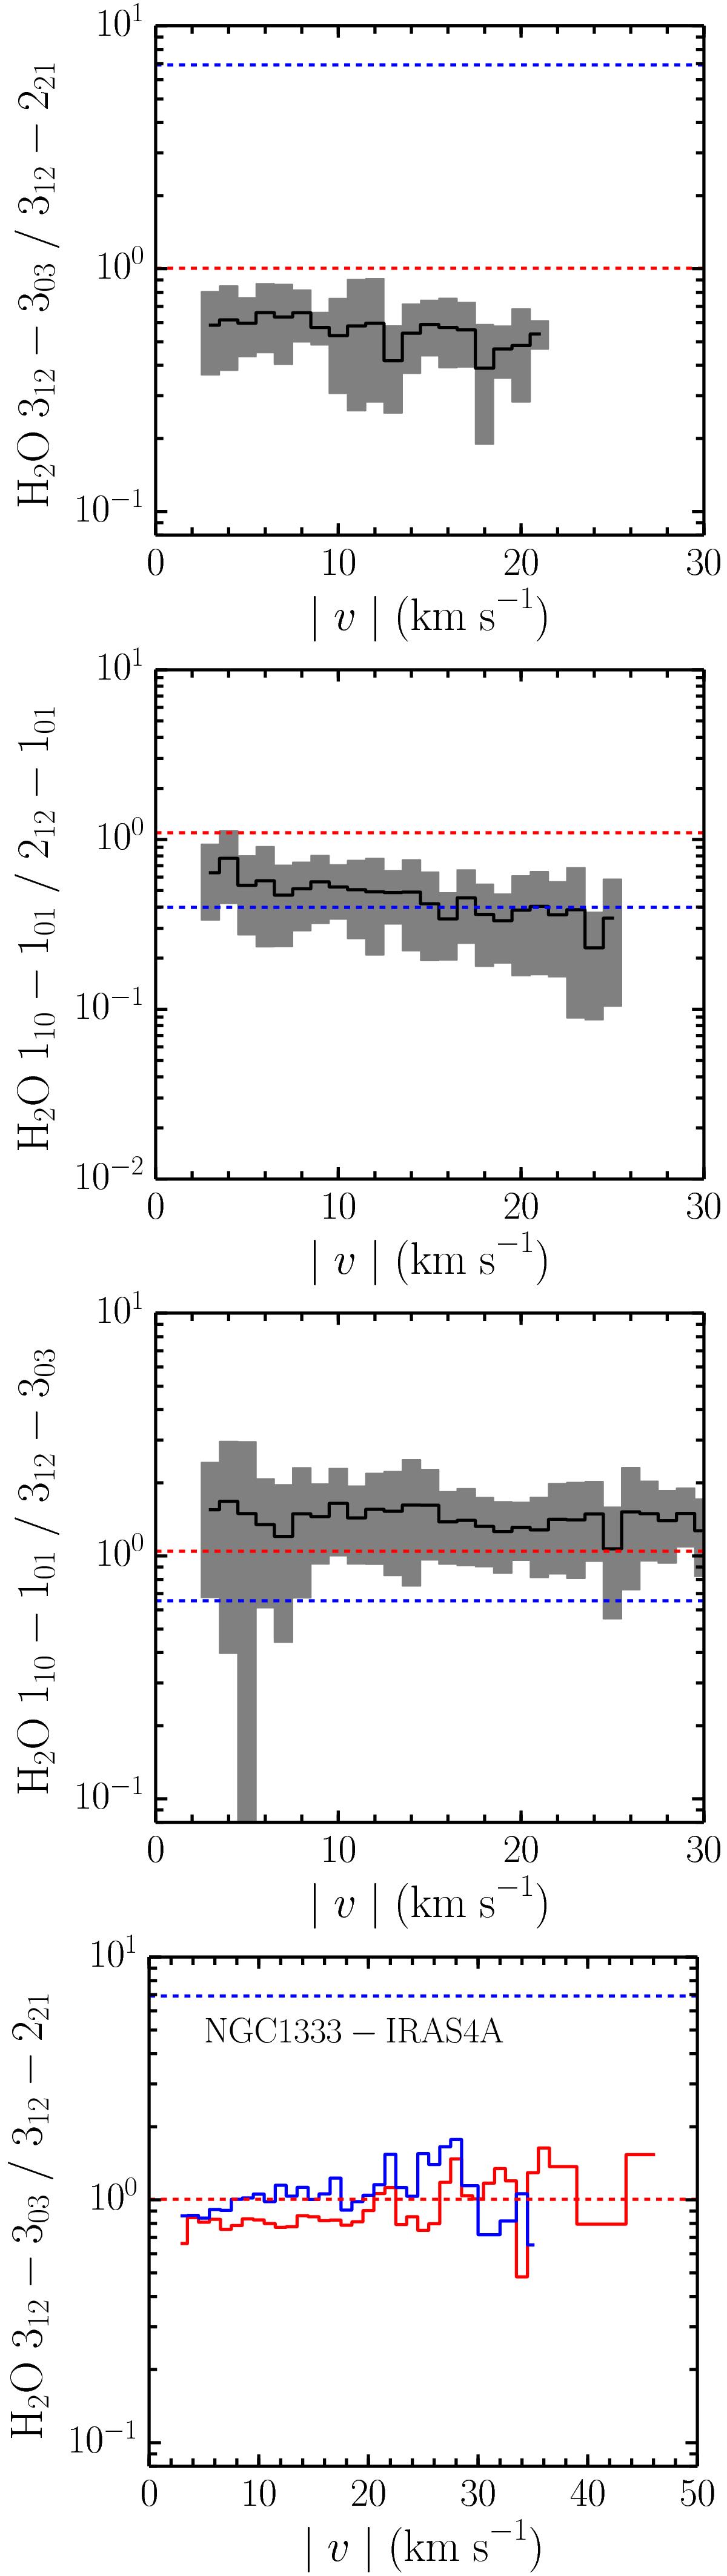
Top and middle: line intensity ratio as a function of velocity averaged over all sources with intensities in both lines above 3σ after resampling to 1 km s-1 bins (black). The grey region indicates the standard deviation of the sources, which is of similar magnitude to the uncertainty in the ratio for a given source. Bottom: line ratio for the red and blue wings of the Class 0 source NGC 1333-IRAS4A. In all panels, the red and blue dashed lines indicate the limits in which both lines are in LTE and optically thick or optically thin respectively for an excitation temperatures of 300 K.
Current usage metrics show cumulative count of Article Views (full-text article views including HTML views, PDF and ePub downloads, according to the available data) and Abstracts Views on Vision4Press platform.
Data correspond to usage on the plateform after 2015. The current usage metrics is available 48-96 hours after online publication and is updated daily on week days.
Initial download of the metrics may take a while.