Fig. 8
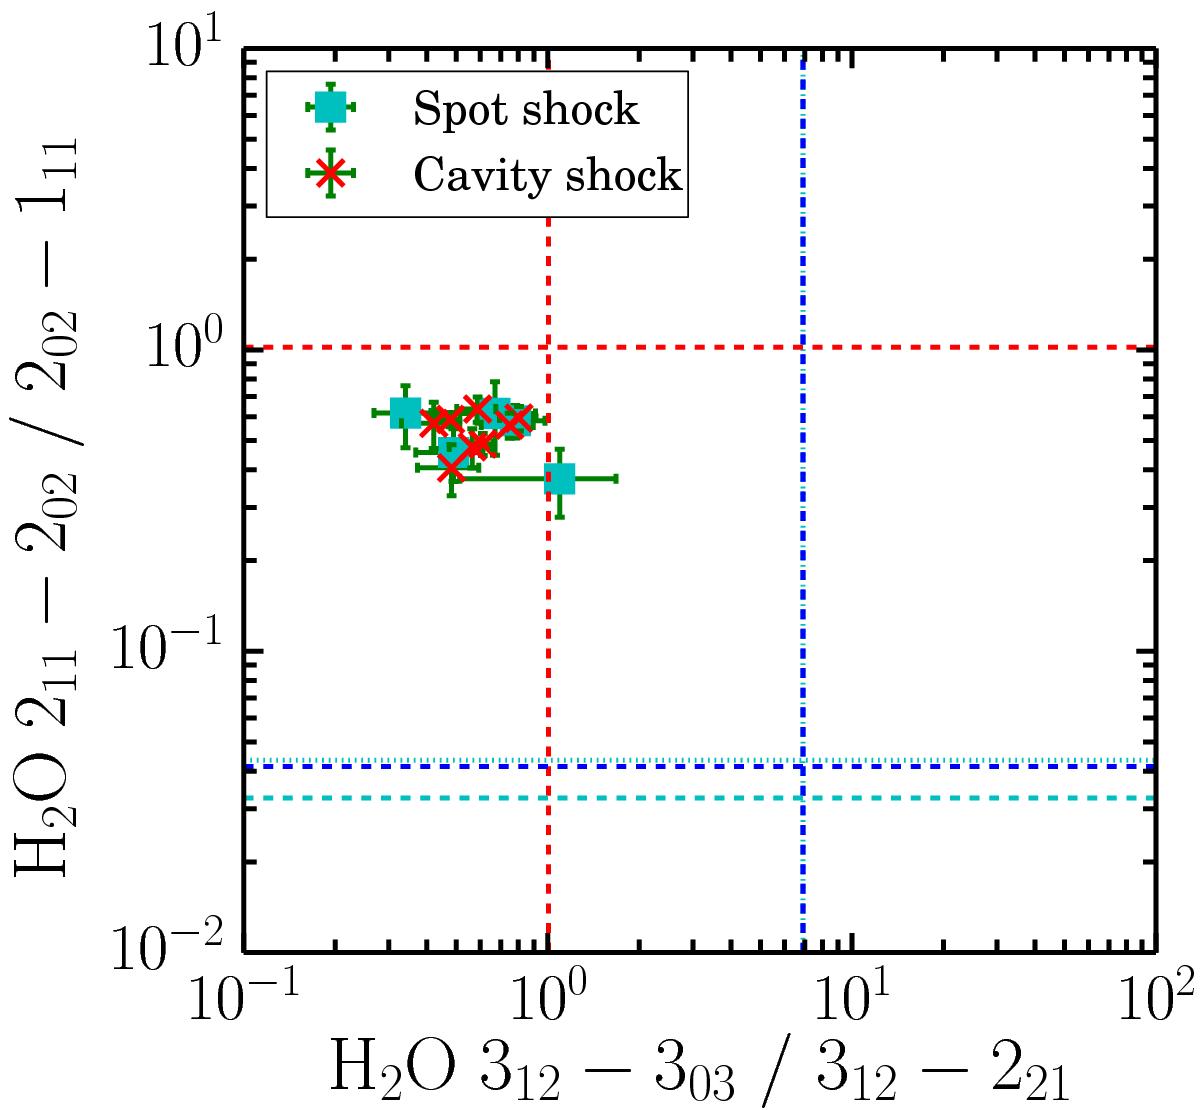
Line ratio vs. line ratio plot. The red dashed lines indicate the limits in which both lines are in LTE and optically thick. The blue dashed, cyan dashed and cyan dotted lines indicate the limits in which both lines are in LTE and optically thin for excitation temperatures of 300, 100 and 500 K respectively. For the x-axis, since the lines share their upper energy level then the ratio is not sensitive to temperature and the optically thin lines lie on top of each other. Observed ratios not on either line indicate either subthermal excitation and/or that one transition is optically thick while the other is optically thin. In both cases, the ratio is then dependant on the excitation conditions of the gas.
Current usage metrics show cumulative count of Article Views (full-text article views including HTML views, PDF and ePub downloads, according to the available data) and Abstracts Views on Vision4Press platform.
Data correspond to usage on the plateform after 2015. The current usage metrics is available 48-96 hours after online publication and is updated daily on week days.
Initial download of the metrics may take a while.