Fig. 7
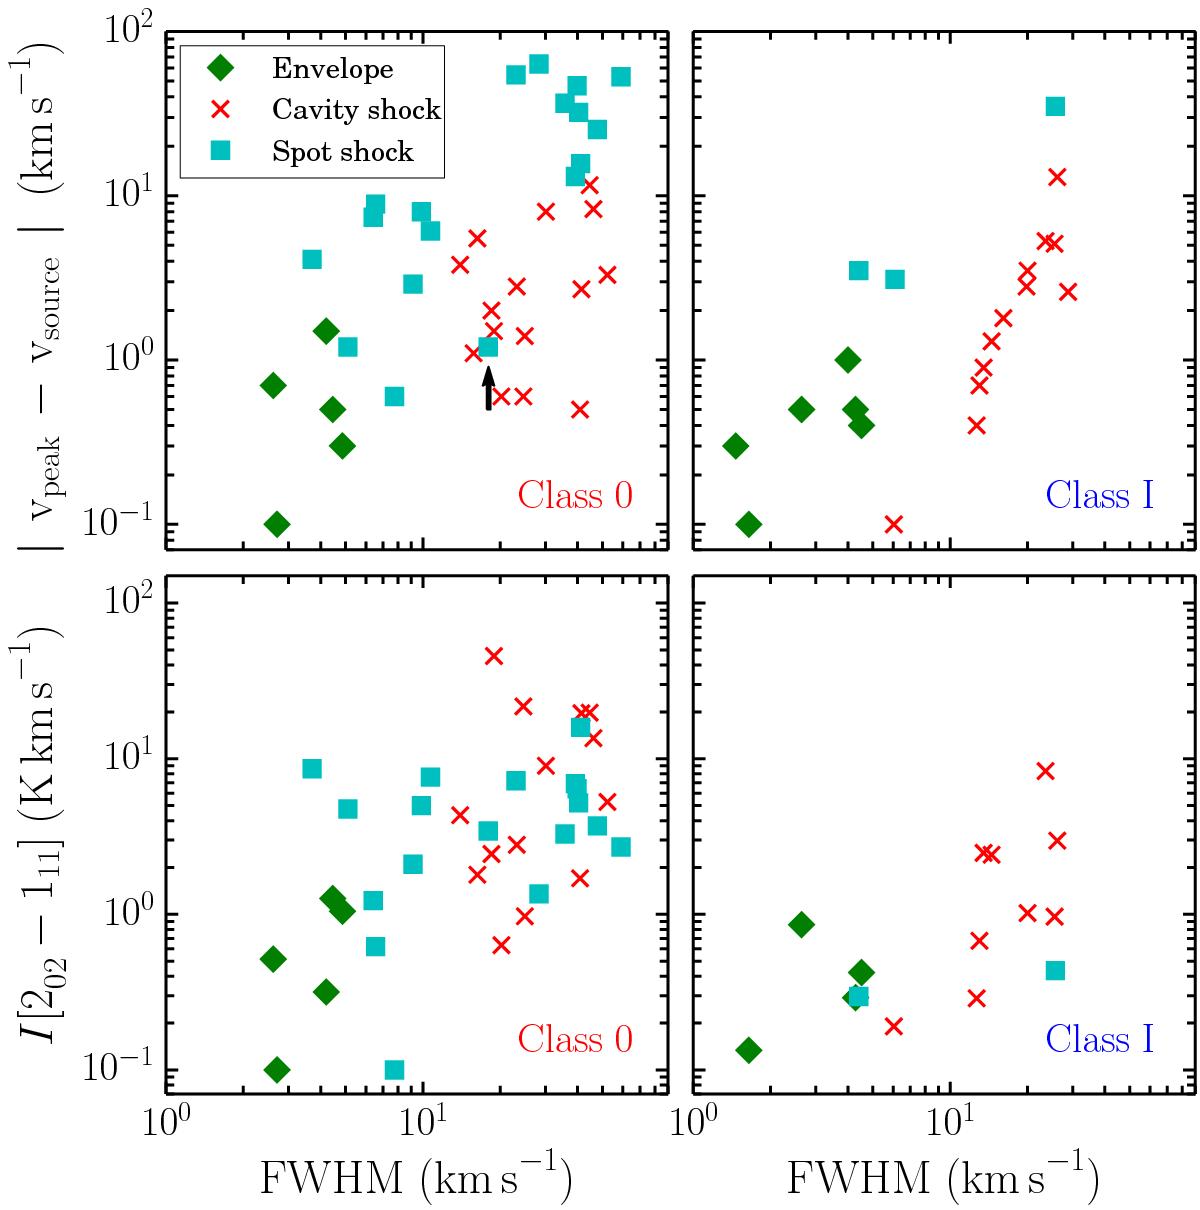
Scatter plots of FWHM vs. offset of the peak from the source velocity (top) and intensity in the 202 −111 line corrected to a common distance of 200 pc (bottom) for the Gaussian components for Class 0 (left) and I (right) sources. When scaling the intensities, a linear scaling was used for the cavity shock components while a point-source scaling was used for the spot shock and envelope components. The black arrow indicates the broader of the two shock spots towards NGC 1333-IRAS4A which is discussed further in Appendix B.3.
Current usage metrics show cumulative count of Article Views (full-text article views including HTML views, PDF and ePub downloads, according to the available data) and Abstracts Views on Vision4Press platform.
Data correspond to usage on the plateform after 2015. The current usage metrics is available 48-96 hours after online publication and is updated daily on week days.
Initial download of the metrics may take a while.