Fig. 4
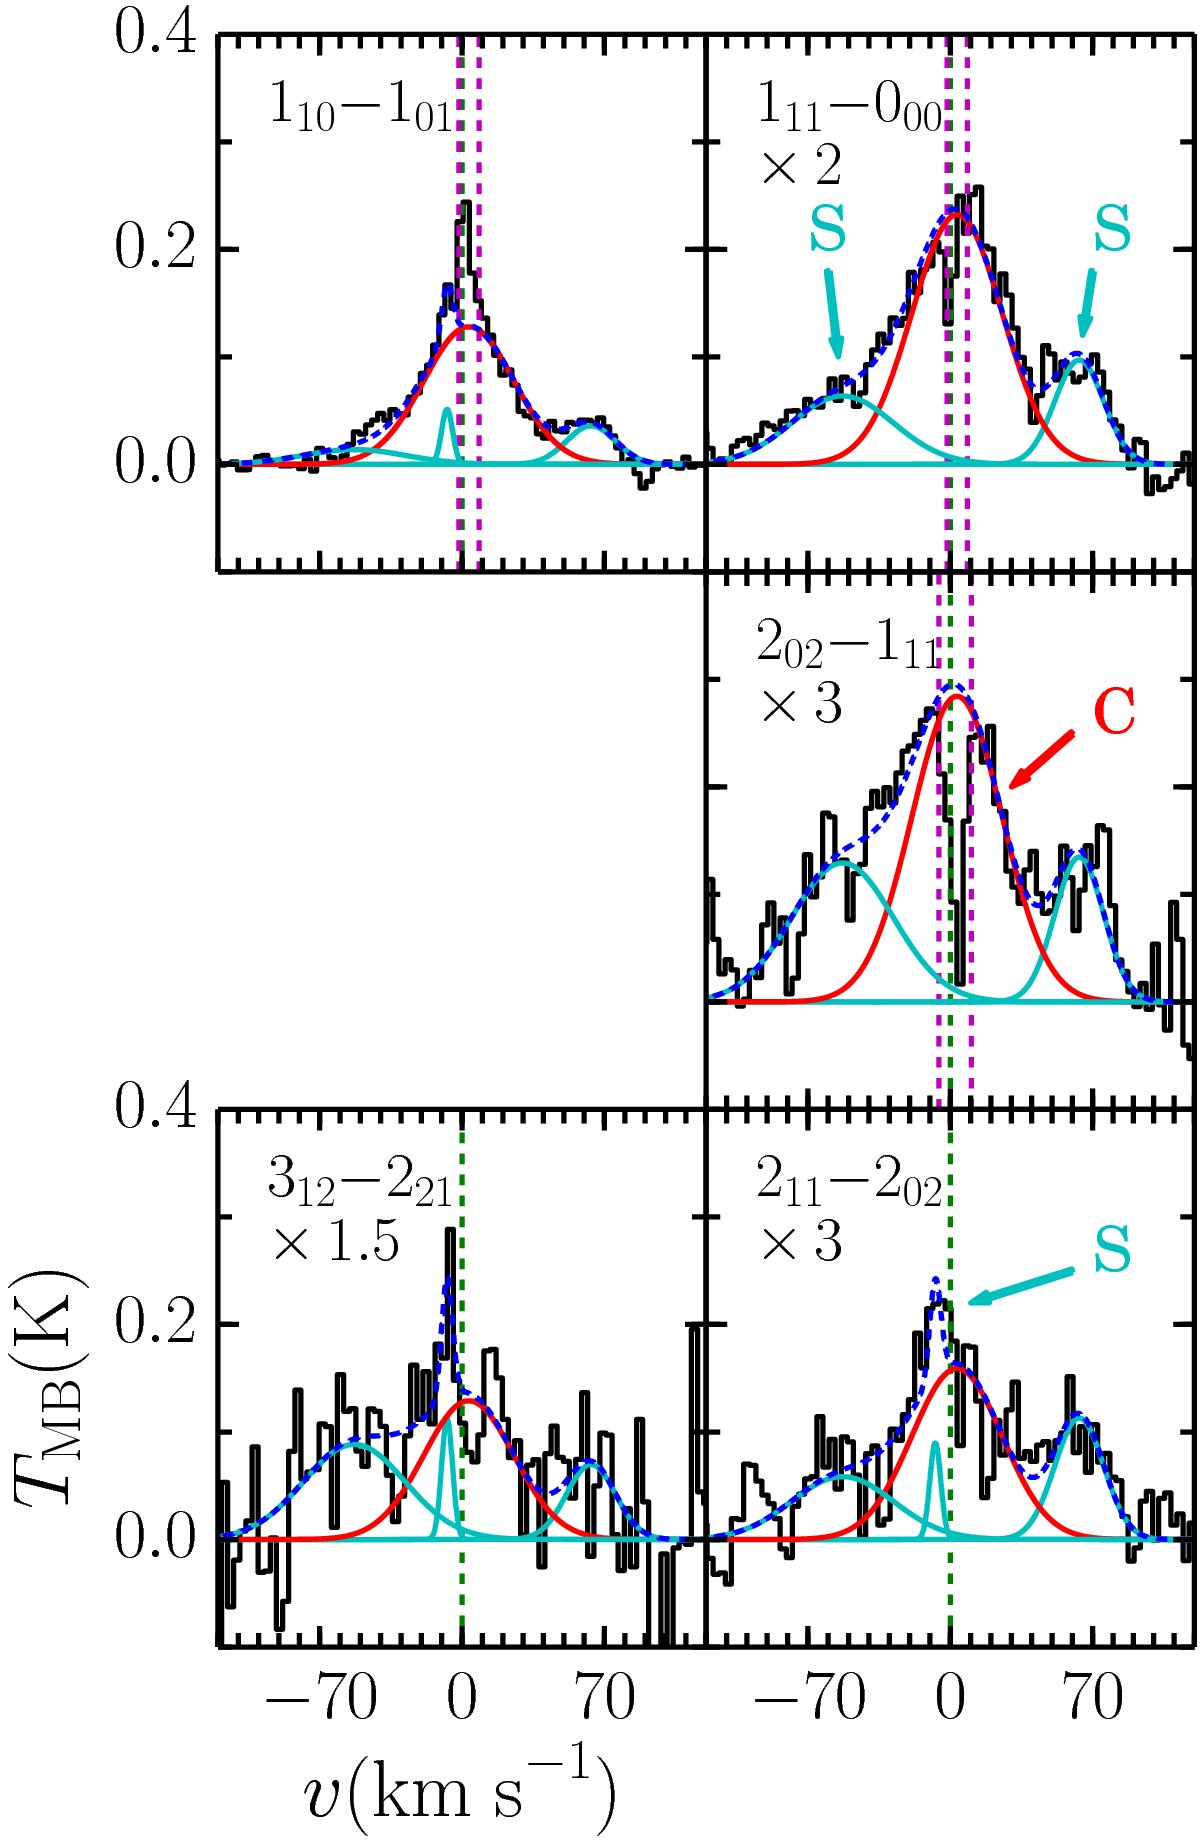
Continuum subtracted WBS spectra for BHR71 (black) resampled to 3 km s-1. The red and cyan lines show the individual Gaussian components for the cavity shock (C) and spot shocks (S) respectively (see text and Table 3 for details) while the blue dashed line shows the combined fit for each line. All spectra have been shifted so that the source velocity is at 0 km s-1, which is indicated by the green dashed lines. At full resolution the quiescent envelope component has an inverse P-cygni profile (see Mottram et al. 2013) and so is masked (indicated by the magenta dashed lines) rather than being fit by multiple components during the Gaussian fitting. The broad absorption in the 202 −111 transition (middle left panel) is caused by reference contamination and is also masked during the fitting process.
Current usage metrics show cumulative count of Article Views (full-text article views including HTML views, PDF and ePub downloads, according to the available data) and Abstracts Views on Vision4Press platform.
Data correspond to usage on the plateform after 2015. The current usage metrics is available 48-96 hours after online publication and is updated daily on week days.
Initial download of the metrics may take a while.