Fig. 3
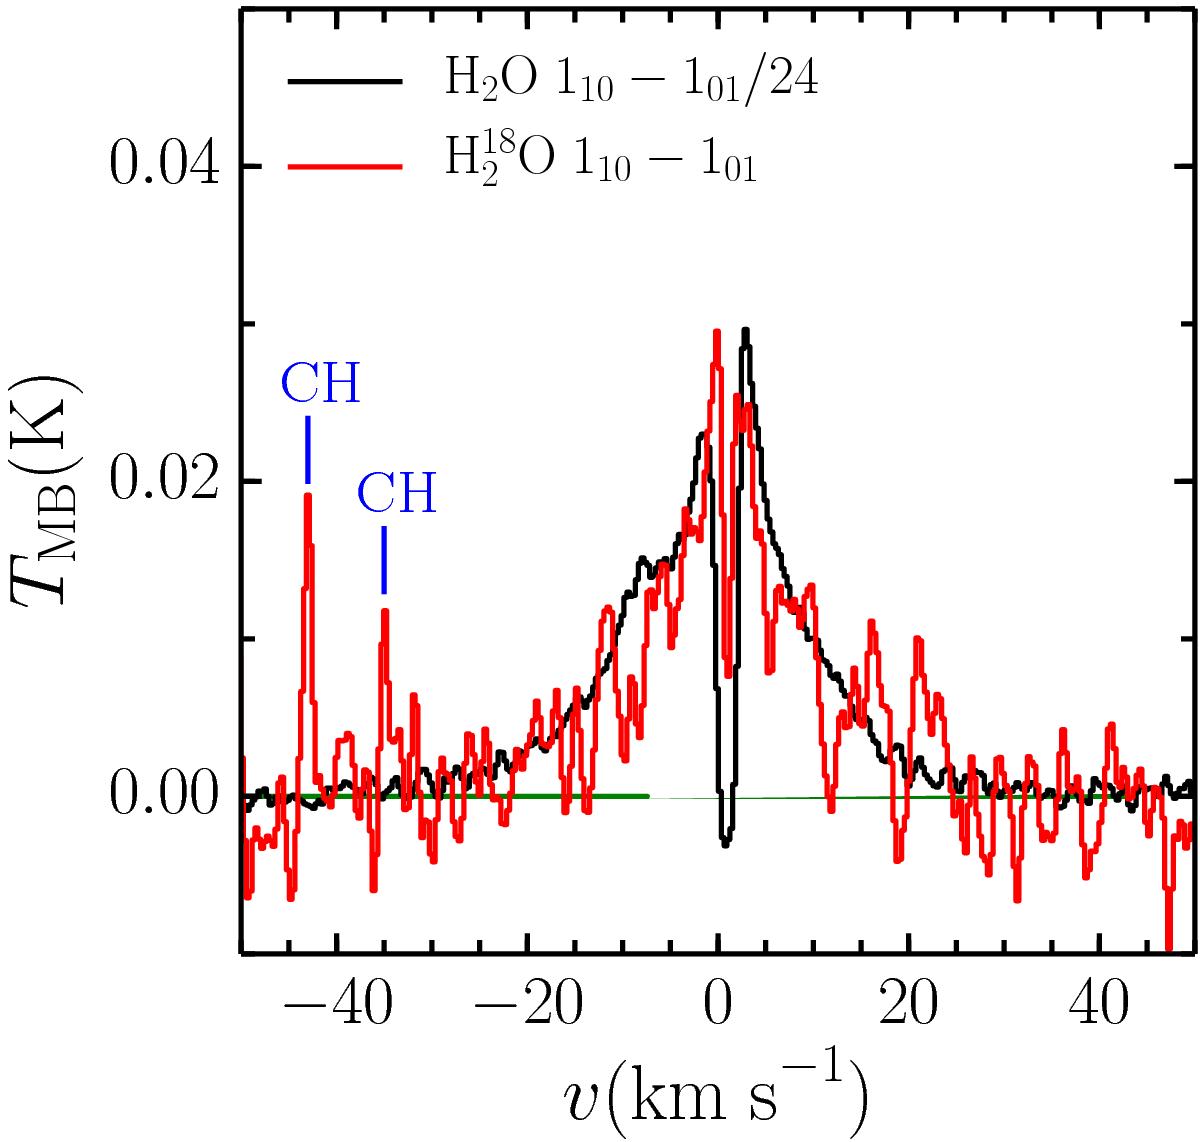
Comparison of the H2O (black) and H![]() O (red) 110 −101 spectra for IRAS4B where the H2O spectrum has been scaled down such that the peak intensities are the same. The green line indicates the baseline. The blue lines indicate the approximate velocities of the CH transitions from the other sideband in the H
O (red) 110 −101 spectra for IRAS4B where the H2O spectrum has been scaled down such that the peak intensities are the same. The green line indicates the baseline. The blue lines indicate the approximate velocities of the CH transitions from the other sideband in the H![]() O observations. The third component of the CH triplet is just beyond the plotted range but is also detected.
O observations. The third component of the CH triplet is just beyond the plotted range but is also detected.
Current usage metrics show cumulative count of Article Views (full-text article views including HTML views, PDF and ePub downloads, according to the available data) and Abstracts Views on Vision4Press platform.
Data correspond to usage on the plateform after 2015. The current usage metrics is available 48-96 hours after online publication and is updated daily on week days.
Initial download of the metrics may take a while.