Fig. 2
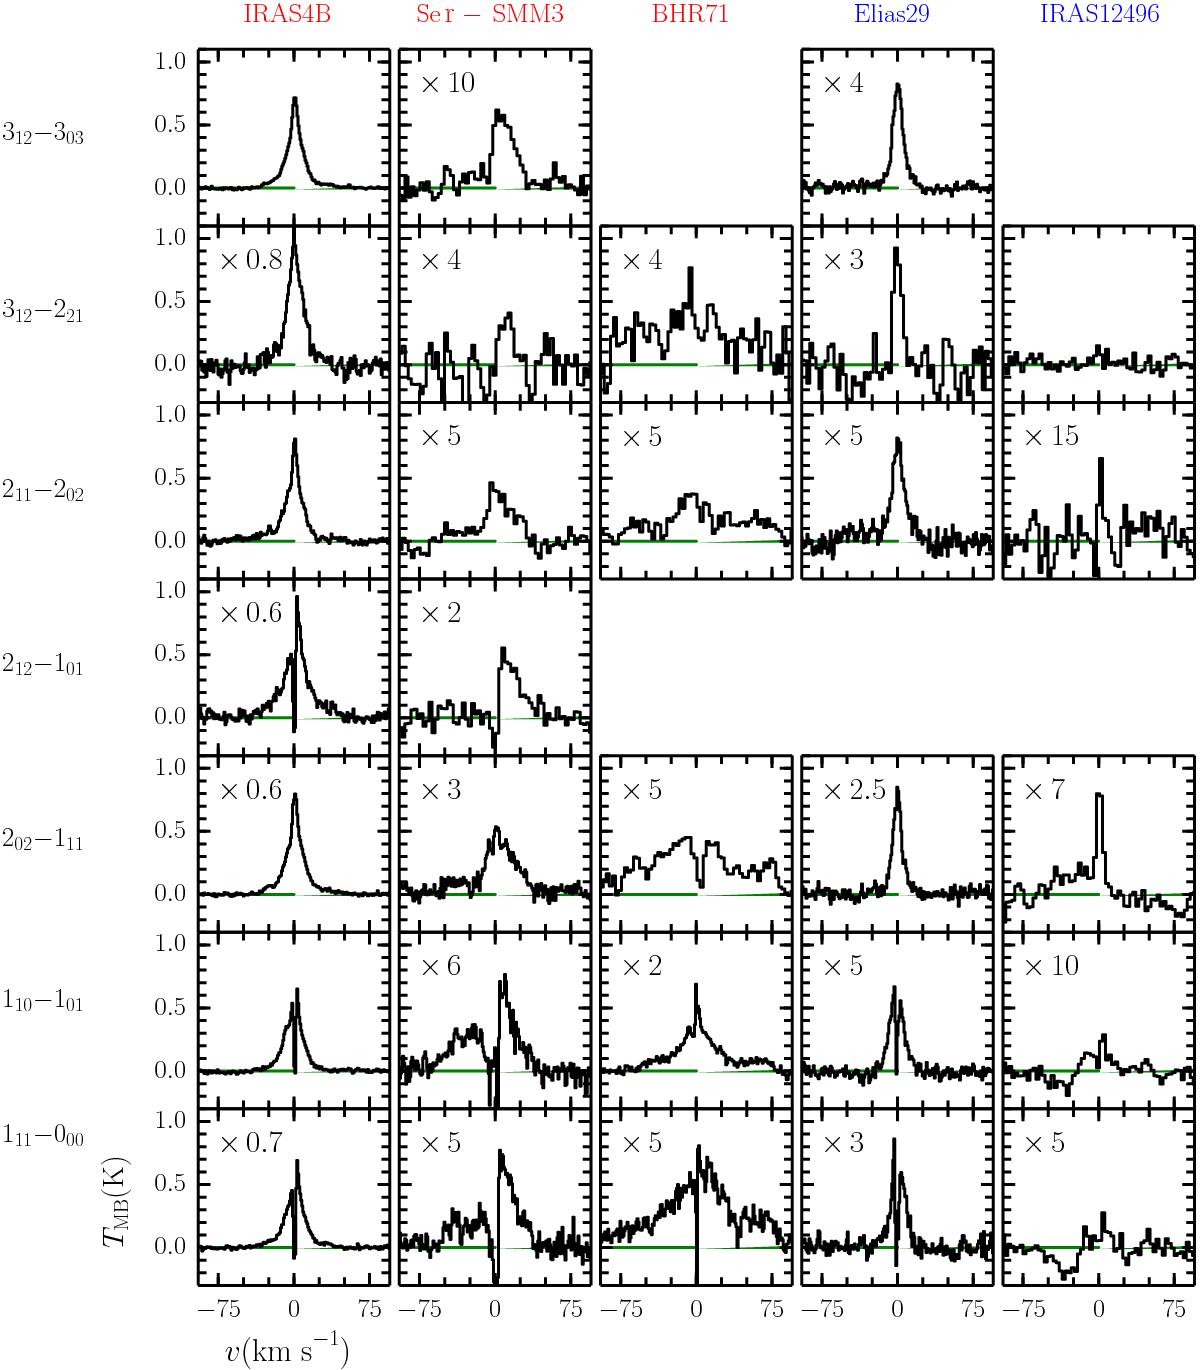
Example H2O spectra for three Class 0 and two Class I sources (names in red and blue respectively). All spectra have been recentred so that the source velocity is at 0 km s-1 and scaled by the number in the top-right corner of each panel. Some spectra have also been resampled to a lower velocity resolution for ease of comparison. The green line indicates the baseline.
Current usage metrics show cumulative count of Article Views (full-text article views including HTML views, PDF and ePub downloads, according to the available data) and Abstracts Views on Vision4Press platform.
Data correspond to usage on the plateform after 2015. The current usage metrics is available 48-96 hours after online publication and is updated daily on week days.
Initial download of the metrics may take a while.