Fig. 15
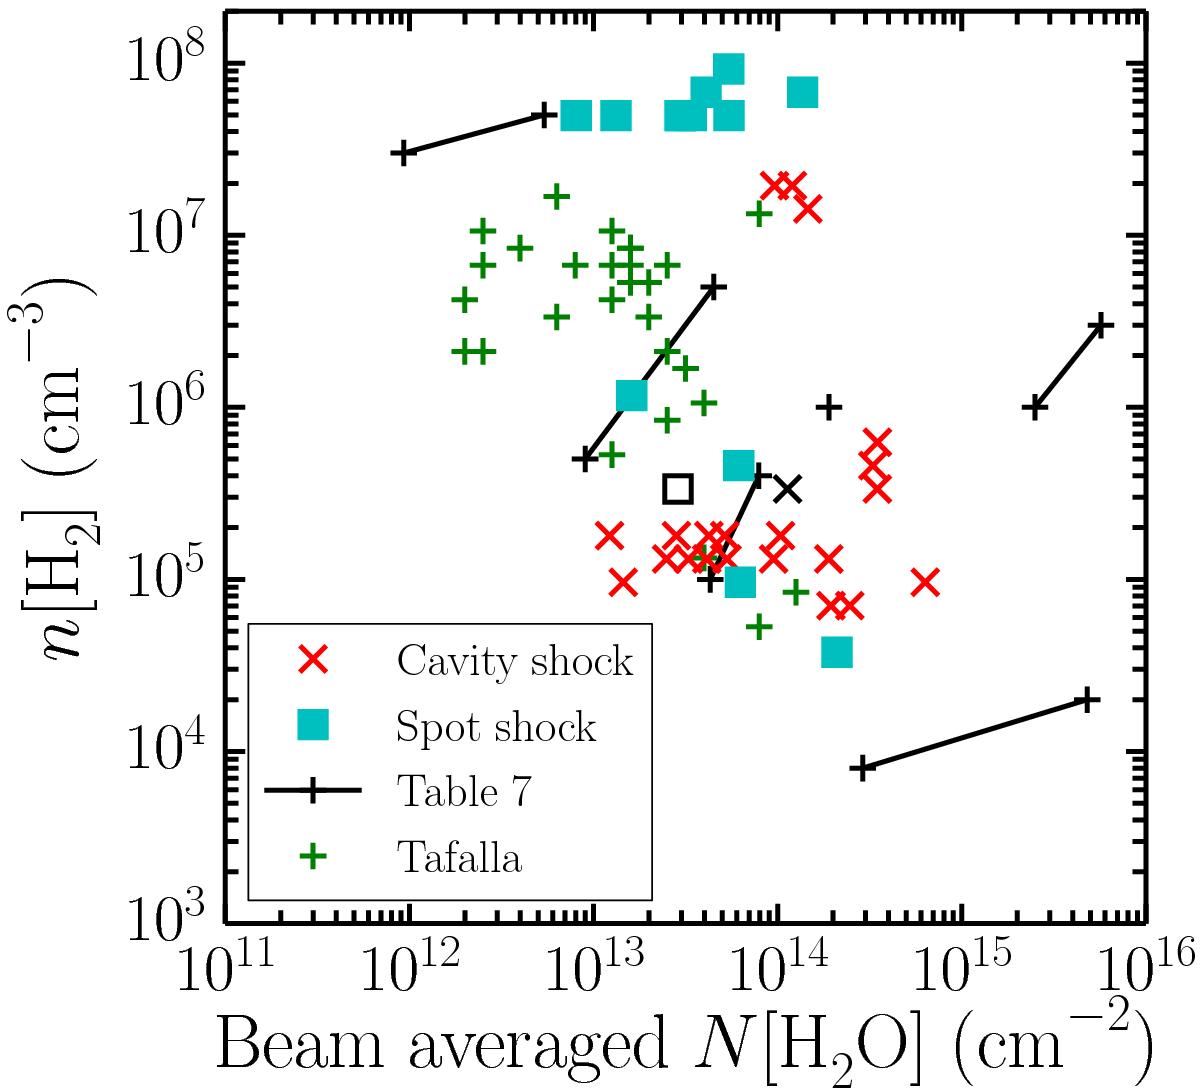
Comparison of the conditions obtained in Sect. 4.4.2 with those from the literature in Table 7 and from Tafalla et al. (2013). The column densities have been averaged over the 110 −101 beam as in Tafalla et al. (2013). The black square and cross indicate the best fit for the average spot and cavity shock line ratios.
Current usage metrics show cumulative count of Article Views (full-text article views including HTML views, PDF and ePub downloads, according to the available data) and Abstracts Views on Vision4Press platform.
Data correspond to usage on the plateform after 2015. The current usage metrics is available 48-96 hours after online publication and is updated daily on week days.
Initial download of the metrics may take a while.