Fig. 11
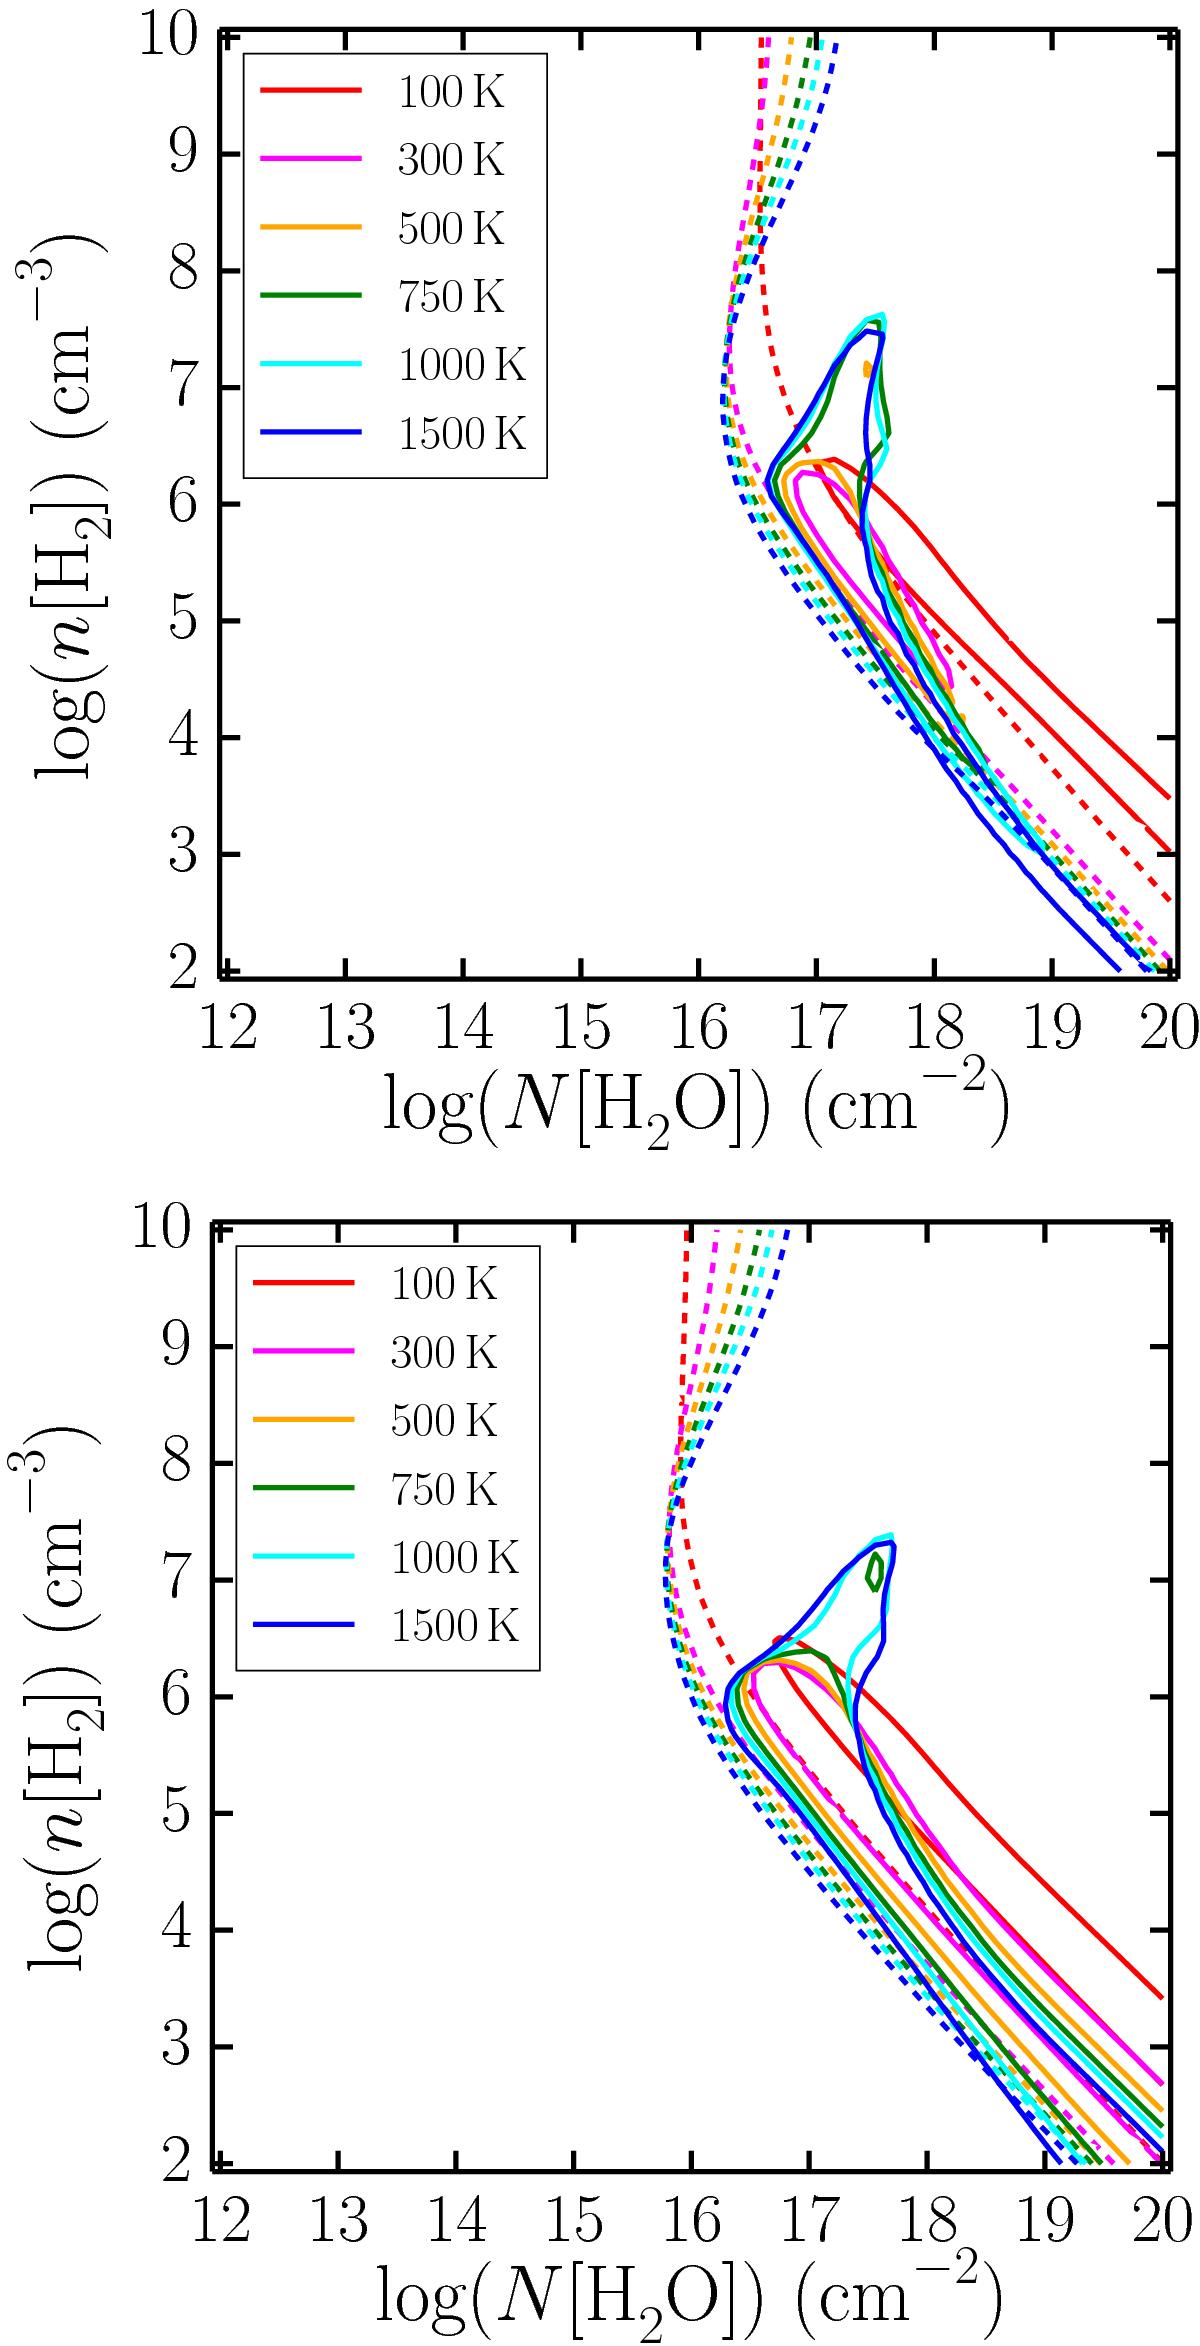
Results of comparison between the average line ratios presented in Table 5 with radex models for a range of nH2 and NH2O for six different temperatures ranging from 100 to 1500 K. The solid lines indicate the region within 1σ while the dashed lines show where the plane-of-the-sky emitting area, obtained from the ratio of the observed and model intensity in the 202 −111 line, corresponds to a circle with radius 100 AU.
Current usage metrics show cumulative count of Article Views (full-text article views including HTML views, PDF and ePub downloads, according to the available data) and Abstracts Views on Vision4Press platform.
Data correspond to usage on the plateform after 2015. The current usage metrics is available 48-96 hours after online publication and is updated daily on week days.
Initial download of the metrics may take a while.