Fig. 10
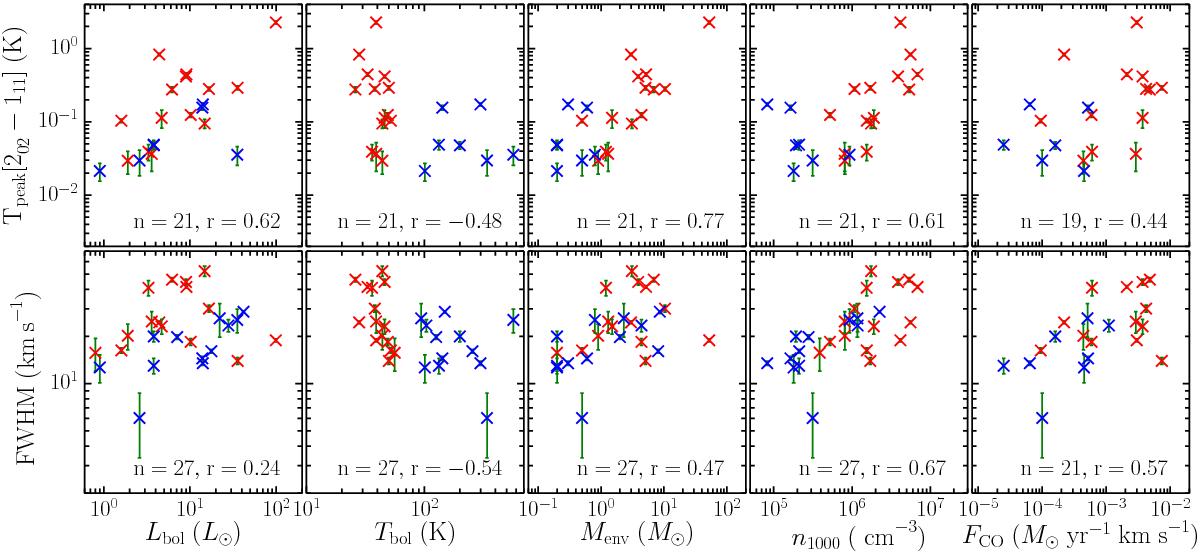
Correlation plots of Tpeak for the 202 − 111 line corrected to a common distance of 200 pc assuming a linear scaling (top) and FWHM (bottom) of the cavity shock component vs., from left to right, Lbol, Tbol, Menv, n1000 and FCO as presented in Table 1. Class 0 and I sources are coloured red and blue respectively. The number of sources and Pearson correlation coefficient are given at the bottom of each panel.
Current usage metrics show cumulative count of Article Views (full-text article views including HTML views, PDF and ePub downloads, according to the available data) and Abstracts Views on Vision4Press platform.
Data correspond to usage on the plateform after 2015. The current usage metrics is available 48-96 hours after online publication and is updated daily on week days.
Initial download of the metrics may take a while.