Free Access
Fig. A.1
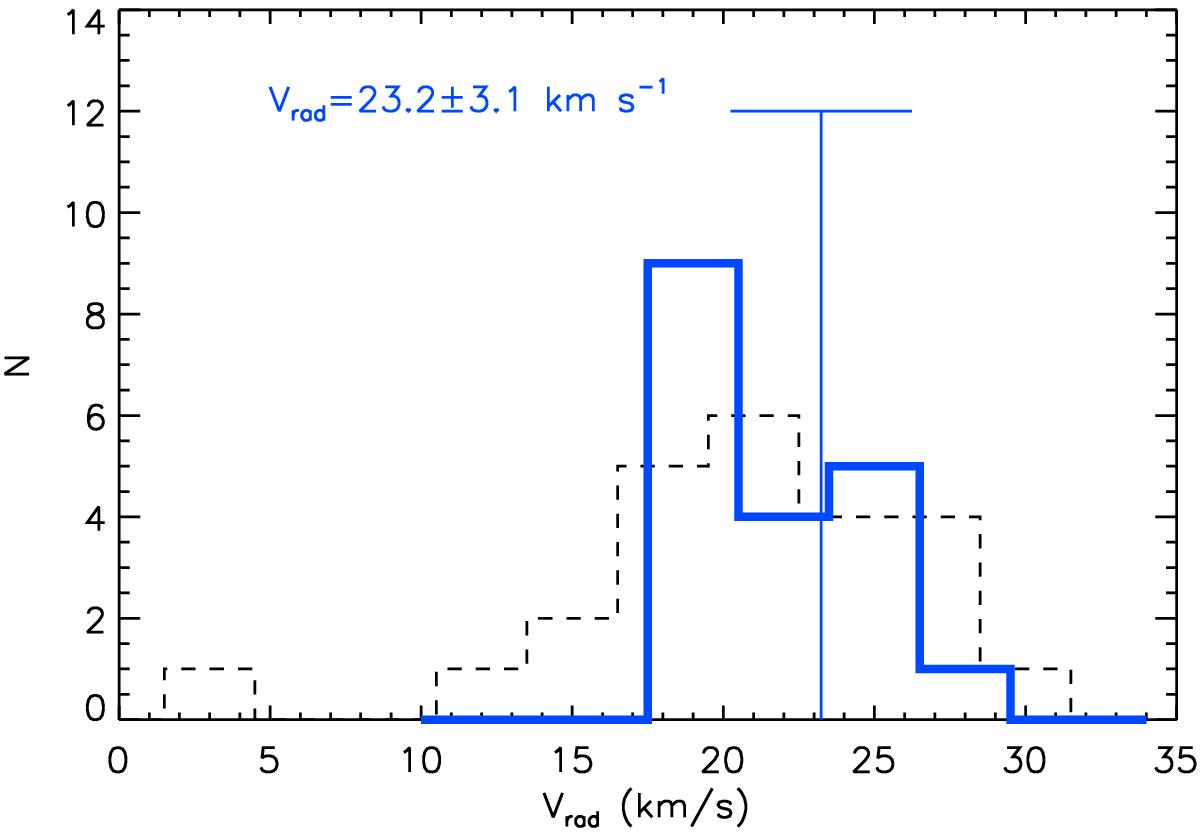
Average RV distribution of the L1615/L1616 low-mass stars (thick solid line). The bar indicates the mean RV value and its standard deviation from the average. The dashed line represents the distribution obtained by Alcalá et al. (2004) for 24 stars in L1616.
Current usage metrics show cumulative count of Article Views (full-text article views including HTML views, PDF and ePub downloads, according to the available data) and Abstracts Views on Vision4Press platform.
Data correspond to usage on the plateform after 2015. The current usage metrics is available 48-96 hours after online publication and is updated daily on week days.
Initial download of the metrics may take a while.