Fig. 7
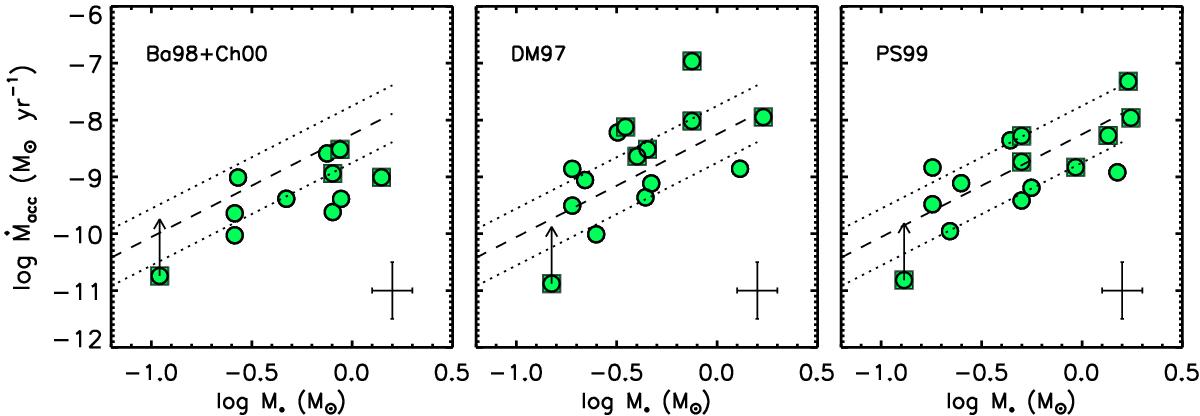
Mass accretion rate versus stellar mass drawn from the Ba98+Ch00, DM97, and PS99 evolutionary tracks, respectively (from the left to the right panel). Dashed and dotted lines represent the Ṁacc − M⋆ relationship and the 1σ deviation from fit obtained with X-Shooter at VLT observations by Alcalá et al. (2014) for YSOs in Lupus. The vertical arrow represents the position of the subluminous object after applying the correction factor described in Appendix C.1. Mean error bars are overplotted on lower-right corner of each panel. Symbols are as in Fig. 2.
Current usage metrics show cumulative count of Article Views (full-text article views including HTML views, PDF and ePub downloads, according to the available data) and Abstracts Views on Vision4Press platform.
Data correspond to usage on the plateform after 2015. The current usage metrics is available 48-96 hours after online publication and is updated daily on week days.
Initial download of the metrics may take a while.