Fig. 6
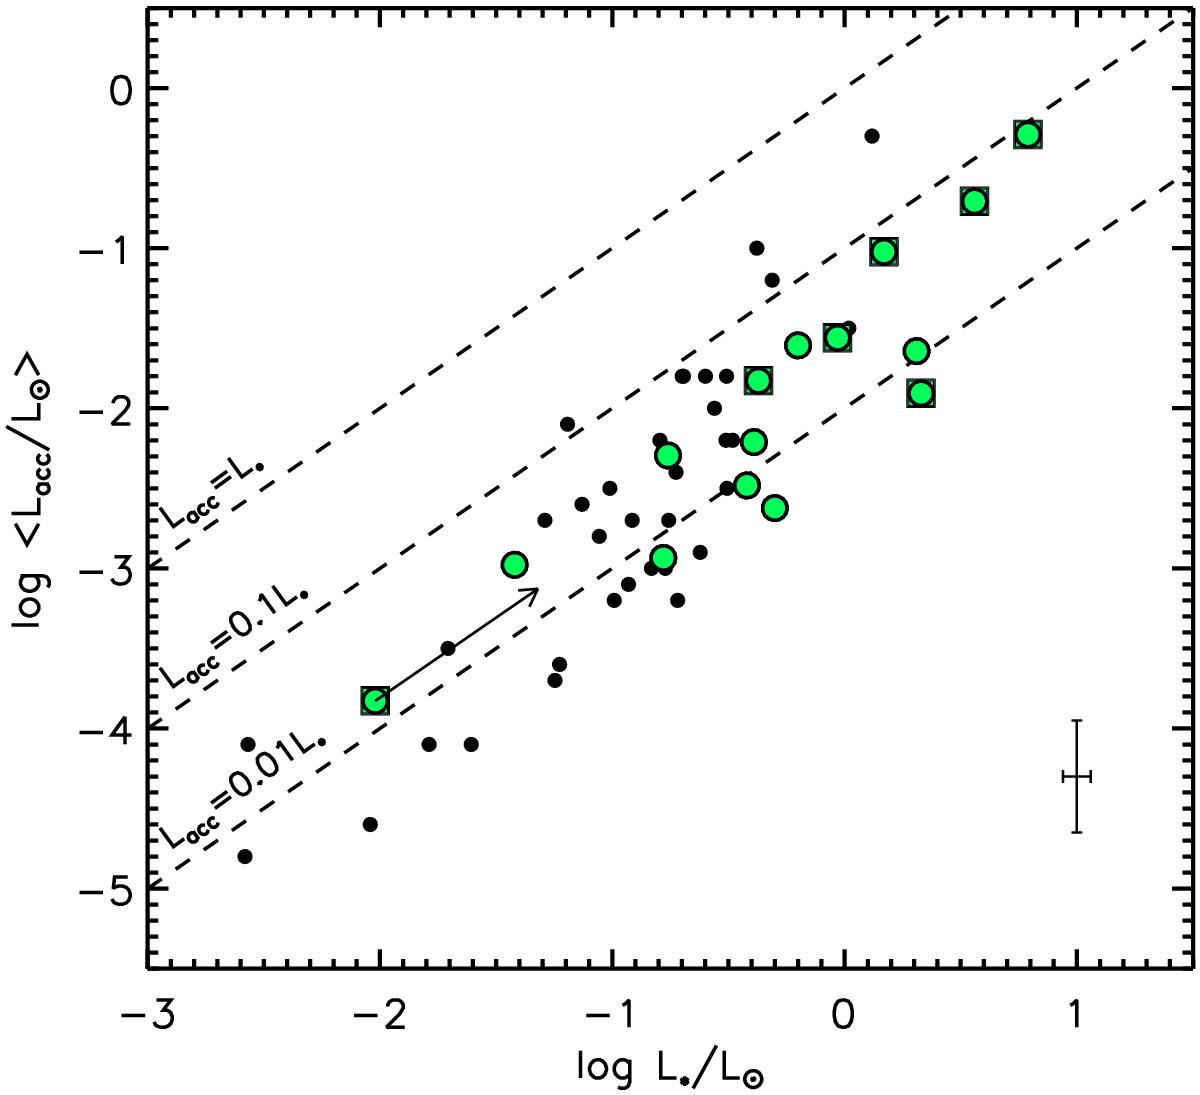
Mean accretion luminosity versus stellar luminosity. Dashed lines represent the loci of the three Lacc − L⋆ relations, as labeled. The arrow represents the position of the subluminous object after applying the correction factor described in Appendix C.1. The Lupus YSOs by Alcalá et al. (2014) are overlaid as small filled dots. Mean error bars are overplotted on the lower-right corner of the panel. Symbols are as in Fig. 2.
Current usage metrics show cumulative count of Article Views (full-text article views including HTML views, PDF and ePub downloads, according to the available data) and Abstracts Views on Vision4Press platform.
Data correspond to usage on the plateform after 2015. The current usage metrics is available 48-96 hours after online publication and is updated daily on week days.
Initial download of the metrics may take a while.