Fig. 2
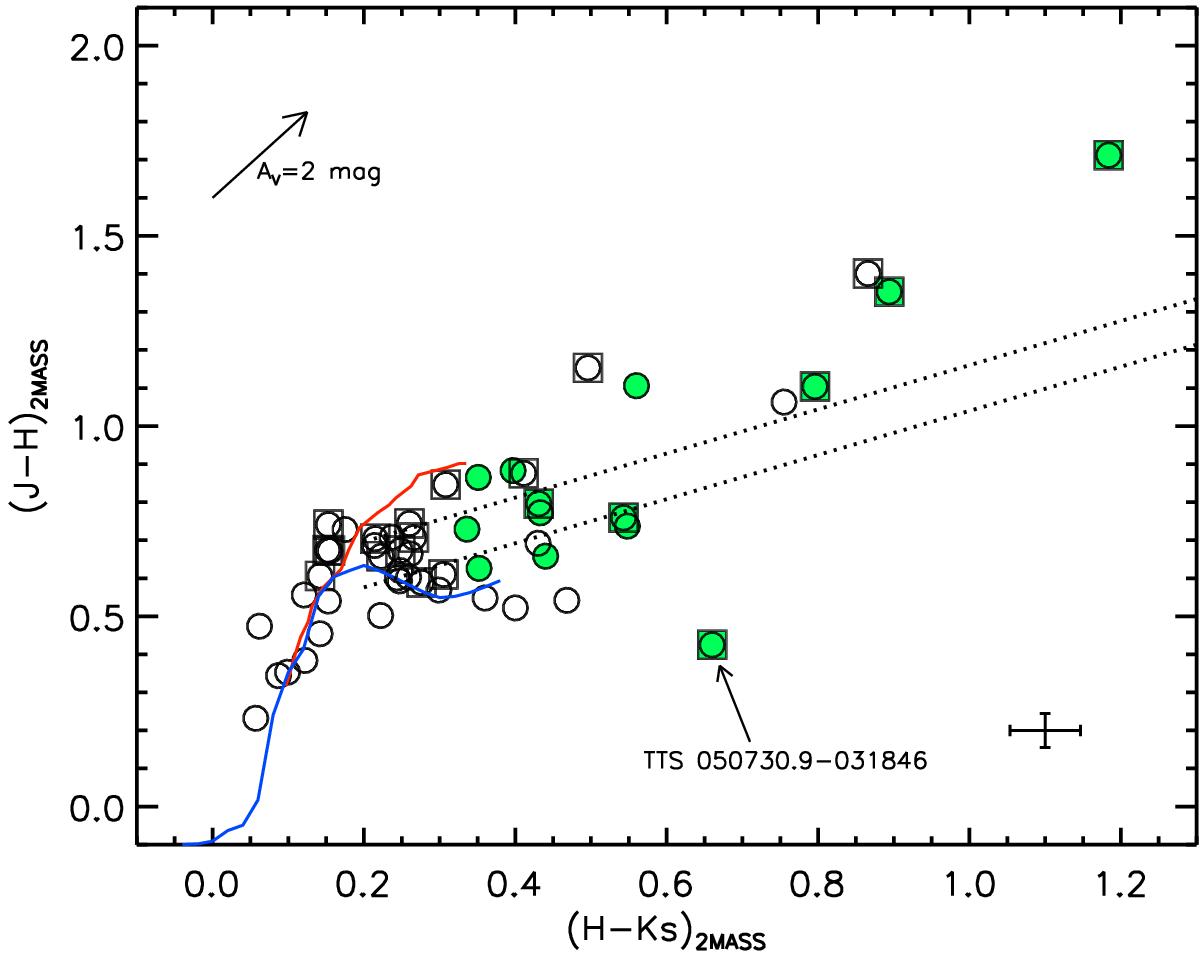
2MASS color−color diagram of the L1615/L1616 targets. Open circles represent low-mass stars analyzed by Gandolfi et al. (2008), while squares mark the targets observed for this work with the FLAMES spectrograph. Filled symbols are the most probable accretors as defined in Sect. 2.2. The dwarf (lower branch; Bessell & Brett 1988) and the giant (upper branch; Kenyon & Hartmann 1995) sequences are marked by solid lines. The arrow at the top upper-left corner indicates the reddening vector for AV = 2 mag. The CTTs locus (Meyer et al. 1997) is delimited by the dotted lines. The position of the subluminous candidate TTS 050730.9−031846 is also displayed. The mean 2MASS photometric errors are overplotted on the lower-right corner of the panel.
Current usage metrics show cumulative count of Article Views (full-text article views including HTML views, PDF and ePub downloads, according to the available data) and Abstracts Views on Vision4Press platform.
Data correspond to usage on the plateform after 2015. The current usage metrics is available 48-96 hours after online publication and is updated daily on week days.
Initial download of the metrics may take a while.