Free Access
Fig. B.1
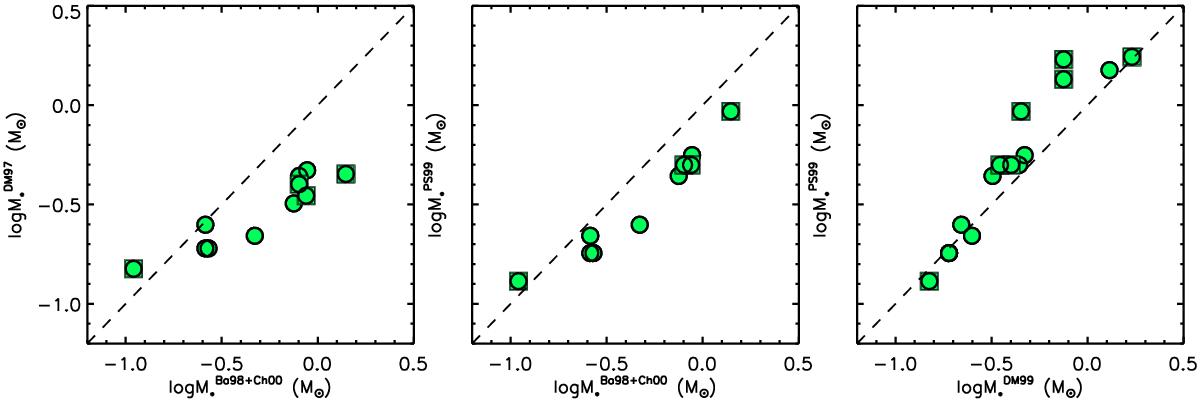
Comparison between masses derived from the Ba98+Ch00 and DM97 tracks (left panel), the Ba98+Ch00 and PS99 tracks (middle panel), and the DM97 and PS99 tracks (right panel) evolutionary tracks. Symbols are as in Fig. 2.
Current usage metrics show cumulative count of Article Views (full-text article views including HTML views, PDF and ePub downloads, according to the available data) and Abstracts Views on Vision4Press platform.
Data correspond to usage on the plateform after 2015. The current usage metrics is available 48-96 hours after online publication and is updated daily on week days.
Initial download of the metrics may take a while.