Fig. 1
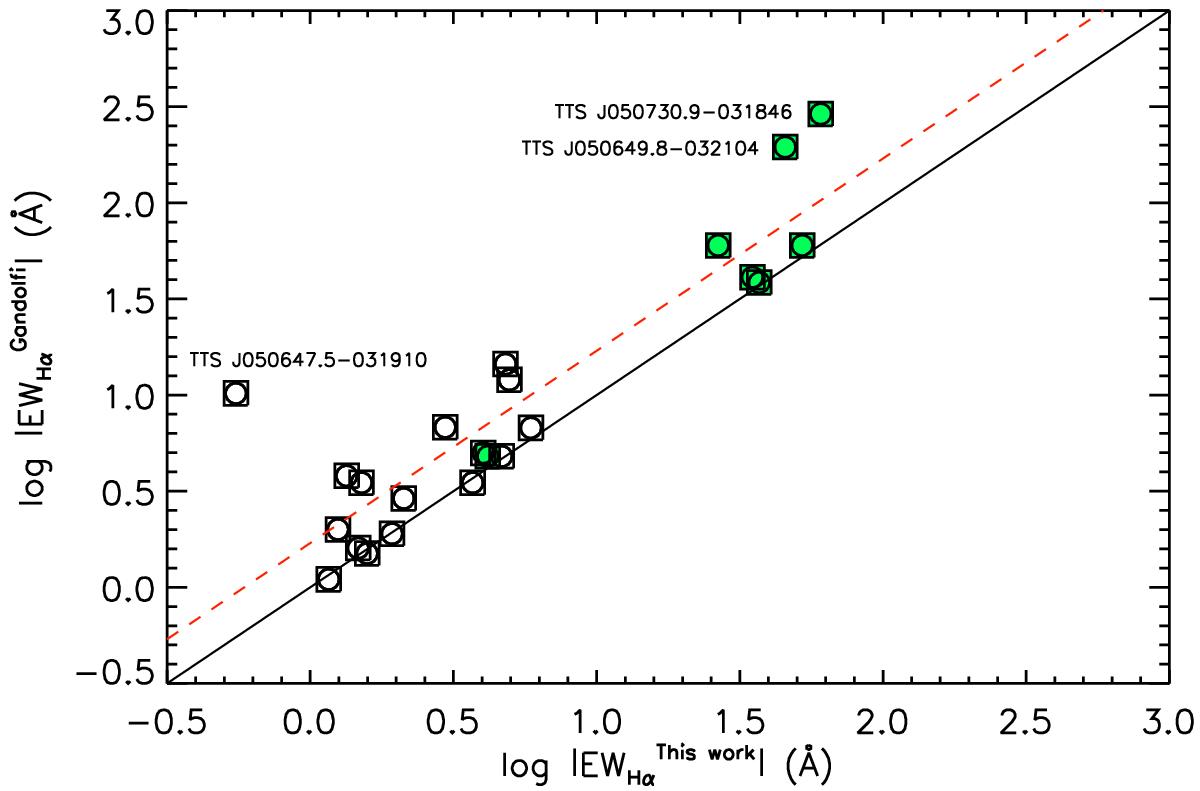
Comparison between our EWHα values and those obtained by Gandolfi et al. (2008). The solid line represents the 1:1 relation, while the dashed line is shifted by the rms difference between the log EWHα values (excluding the three most deviating objects labeled in the figure). Filled symbols refer to most probable accreting stars (see text and Fig. 2).
Current usage metrics show cumulative count of Article Views (full-text article views including HTML views, PDF and ePub downloads, according to the available data) and Abstracts Views on Vision4Press platform.
Data correspond to usage on the plateform after 2015. The current usage metrics is available 48-96 hours after online publication and is updated daily on week days.
Initial download of the metrics may take a while.