Fig. 2
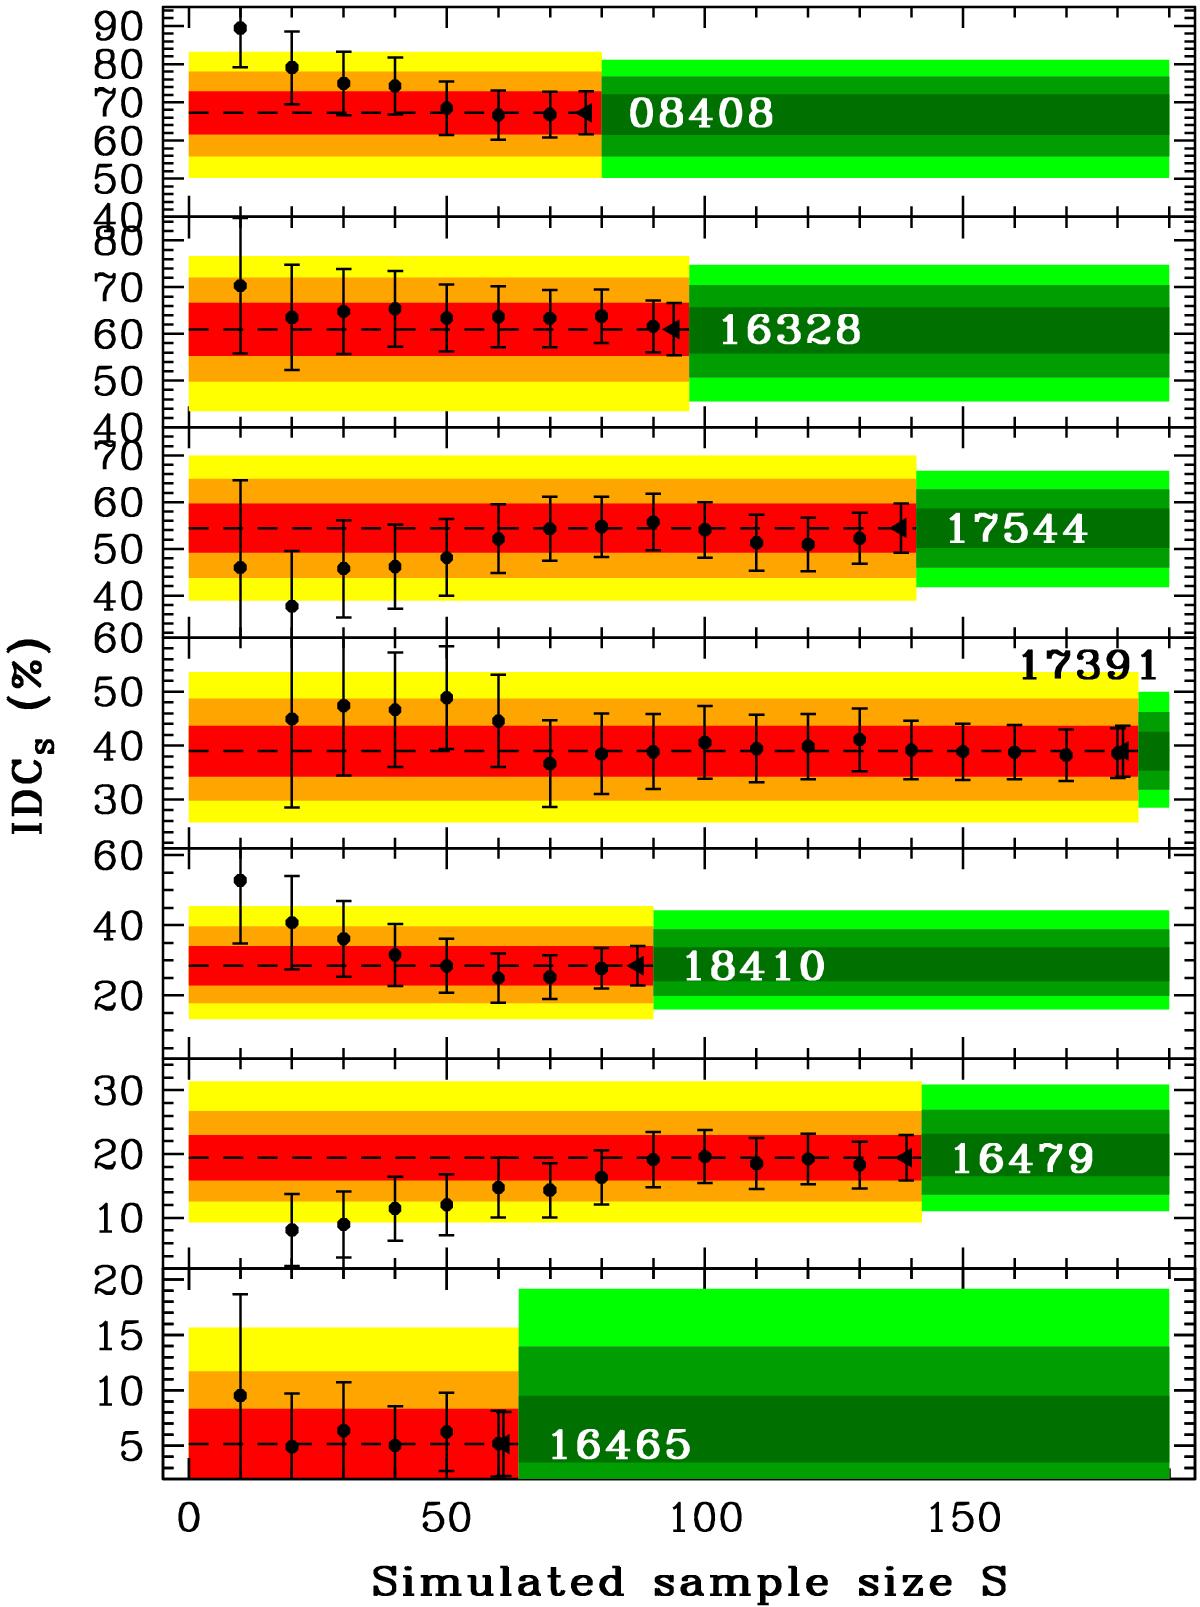
Simulated sample means and their errors ![]() as a function of sample size S (points) for the yearly sample. The last point (filled triangle) is the simulation for N points. The shaded areas mark the 68.3% (red), 95.4% (orange), and 99.7% (yellow) confidence intervals for IDCsim (see Sect. 3) and from Eq. (7) (dark green, green, light green, respectively; see Table 1 in the case of a uninformative prior, a = b = 1).
as a function of sample size S (points) for the yearly sample. The last point (filled triangle) is the simulation for N points. The shaded areas mark the 68.3% (red), 95.4% (orange), and 99.7% (yellow) confidence intervals for IDCsim (see Sect. 3) and from Eq. (7) (dark green, green, light green, respectively; see Table 1 in the case of a uninformative prior, a = b = 1).
Current usage metrics show cumulative count of Article Views (full-text article views including HTML views, PDF and ePub downloads, according to the available data) and Abstracts Views on Vision4Press platform.
Data correspond to usage on the plateform after 2015. The current usage metrics is available 48-96 hours after online publication and is updated daily on week days.
Initial download of the metrics may take a while.