Free Access
Fig. 1
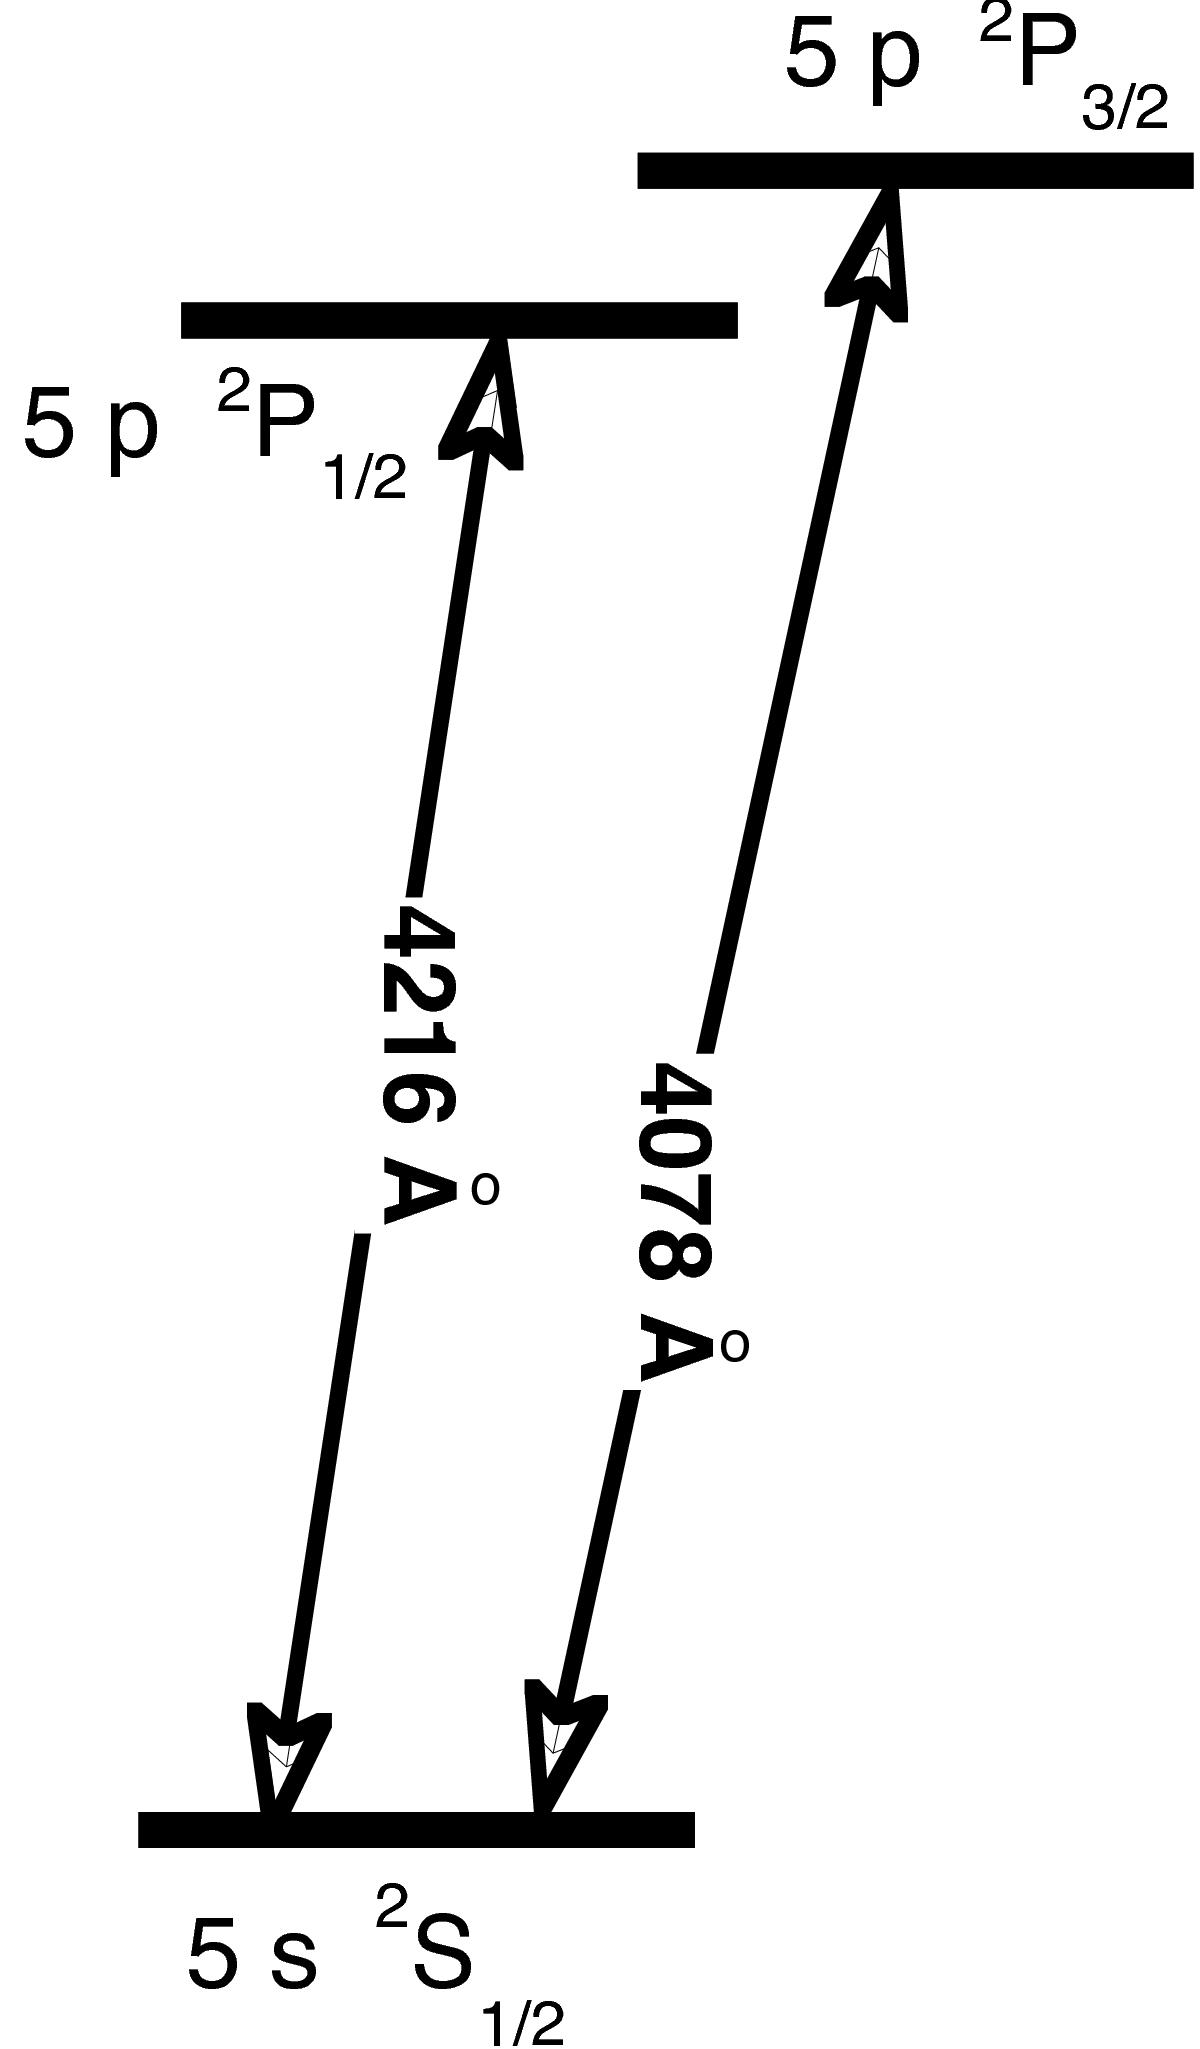
Partial Grotrian diagram of Sr ii showing the levels and the spectral wavelengths taken into account in the case of the simplified model. Note that the level spacings are not to scale.
Current usage metrics show cumulative count of Article Views (full-text article views including HTML views, PDF and ePub downloads, according to the available data) and Abstracts Views on Vision4Press platform.
Data correspond to usage on the plateform after 2015. The current usage metrics is available 48-96 hours after online publication and is updated daily on week days.
Initial download of the metrics may take a while.