Fig. 9
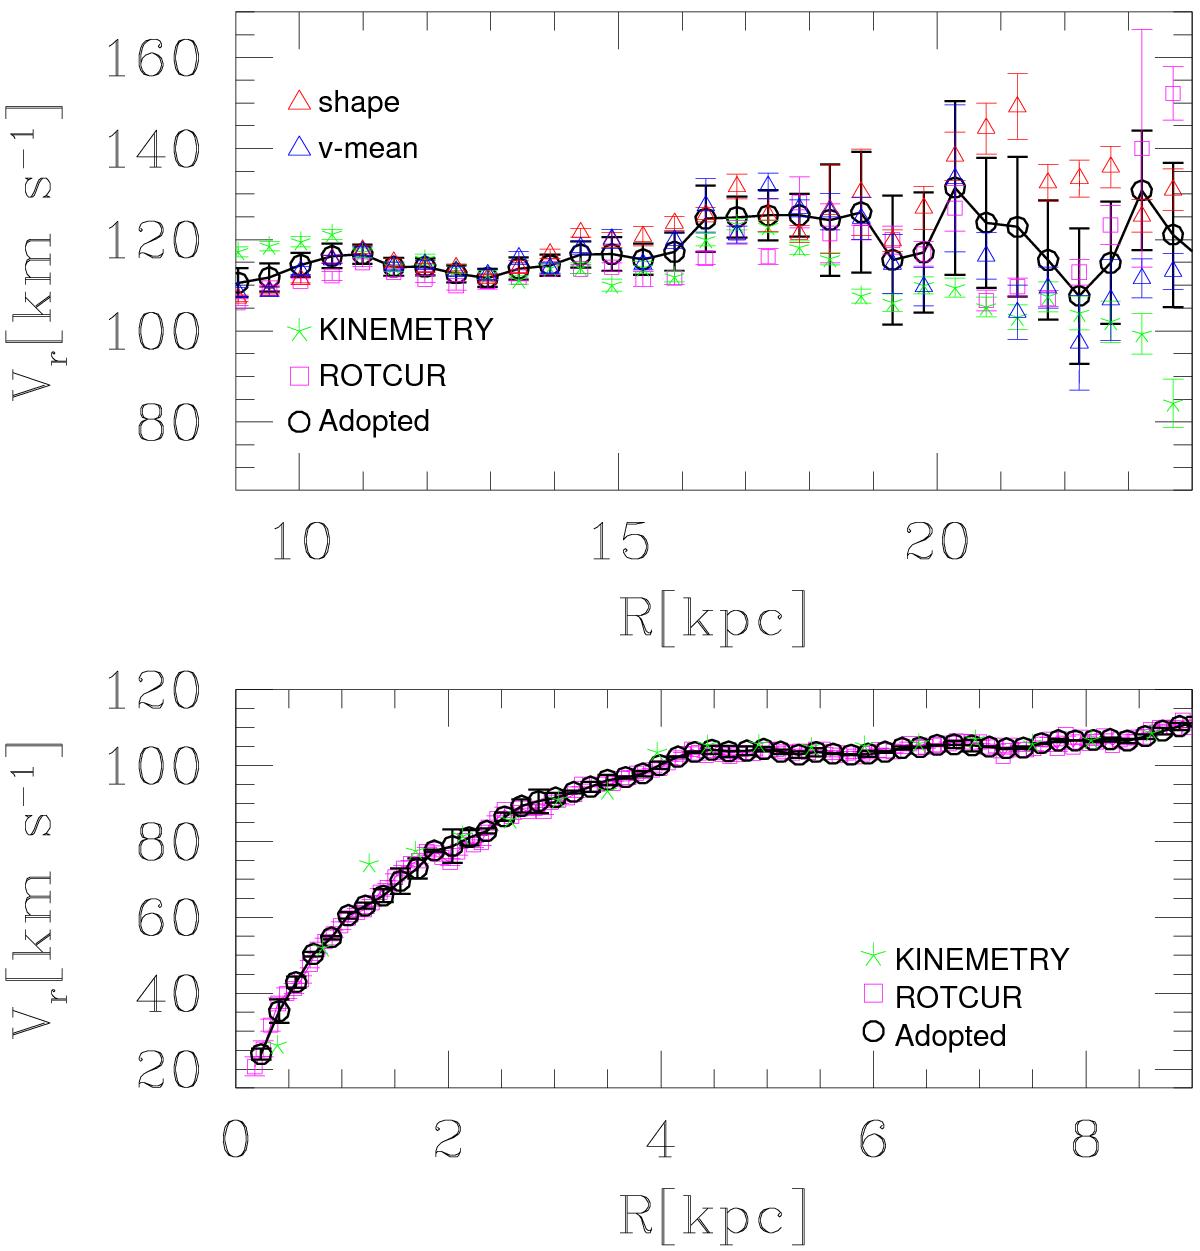
Adopted rotation curve (open black circles) for the inner regions (bottom panel) using the peak velocities and for the outer regions (top panel) using the moment-1. The dispersions take into account variation of Vr between different deconvolution models, the 2% variations around the minimum χ2, and the standard deviation of the mean velocity in each bin. In both panels, the open square and asterisk symbols (in magenta and green in the online version) show Vr according to the ROTCUR and KINEMETRY deconvolution model, respectively. In the top panel the open triangles are for the moment-1 velocities deconvolved according to model-shape and model-mean (in red and blue colors, respectively in the online version).
Current usage metrics show cumulative count of Article Views (full-text article views including HTML views, PDF and ePub downloads, according to the available data) and Abstracts Views on Vision4Press platform.
Data correspond to usage on the plateform after 2015. The current usage metrics is available 48-96 hours after online publication and is updated daily on week days.
Initial download of the metrics may take a while.