Fig. 5
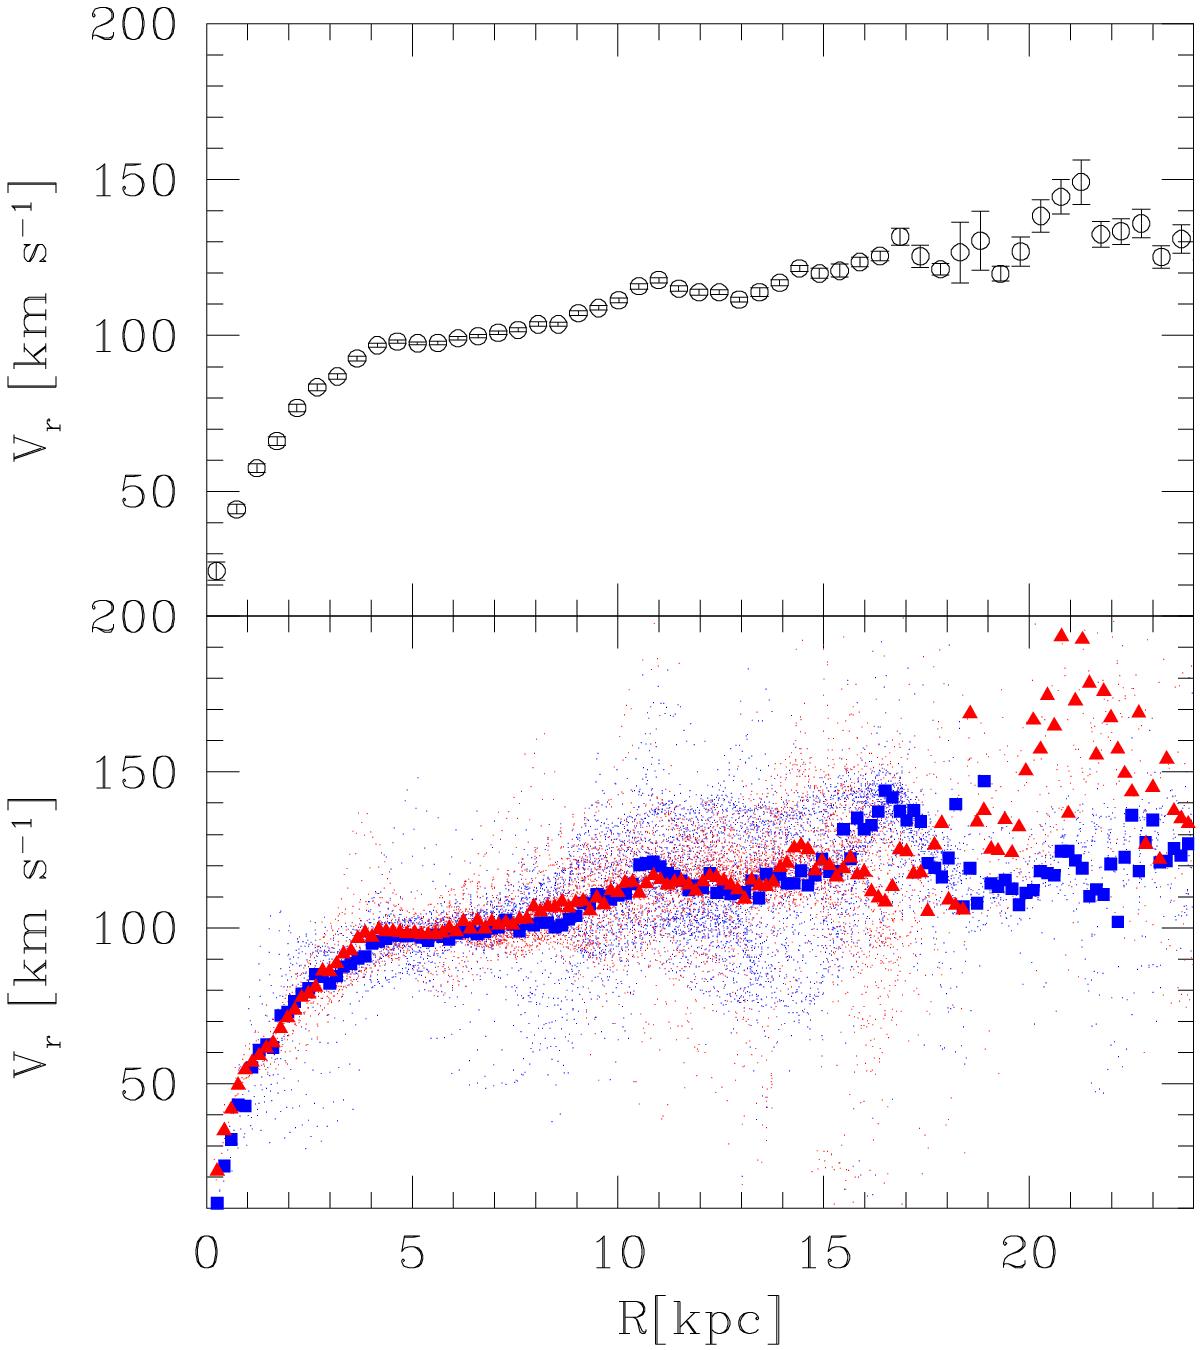
Bottom panel: rotational velocities for each pixel in the first moment-1 map (small dots), the average values in each ring (large symbols, red symbols are for the southern half and blue symbols for the northern half in the online version). The model-mean has been used to deconvolve the data. Triangles are for the southern half while squares are for the northern half. The average rotation curve using moment-1 (mean) velocities is shown in the top panel. Bins are 2 arcmin wide in the radial direction.
Current usage metrics show cumulative count of Article Views (full-text article views including HTML views, PDF and ePub downloads, according to the available data) and Abstracts Views on Vision4Press platform.
Data correspond to usage on the plateform after 2015. The current usage metrics is available 48-96 hours after online publication and is updated daily on week days.
Initial download of the metrics may take a while.