Fig. 17
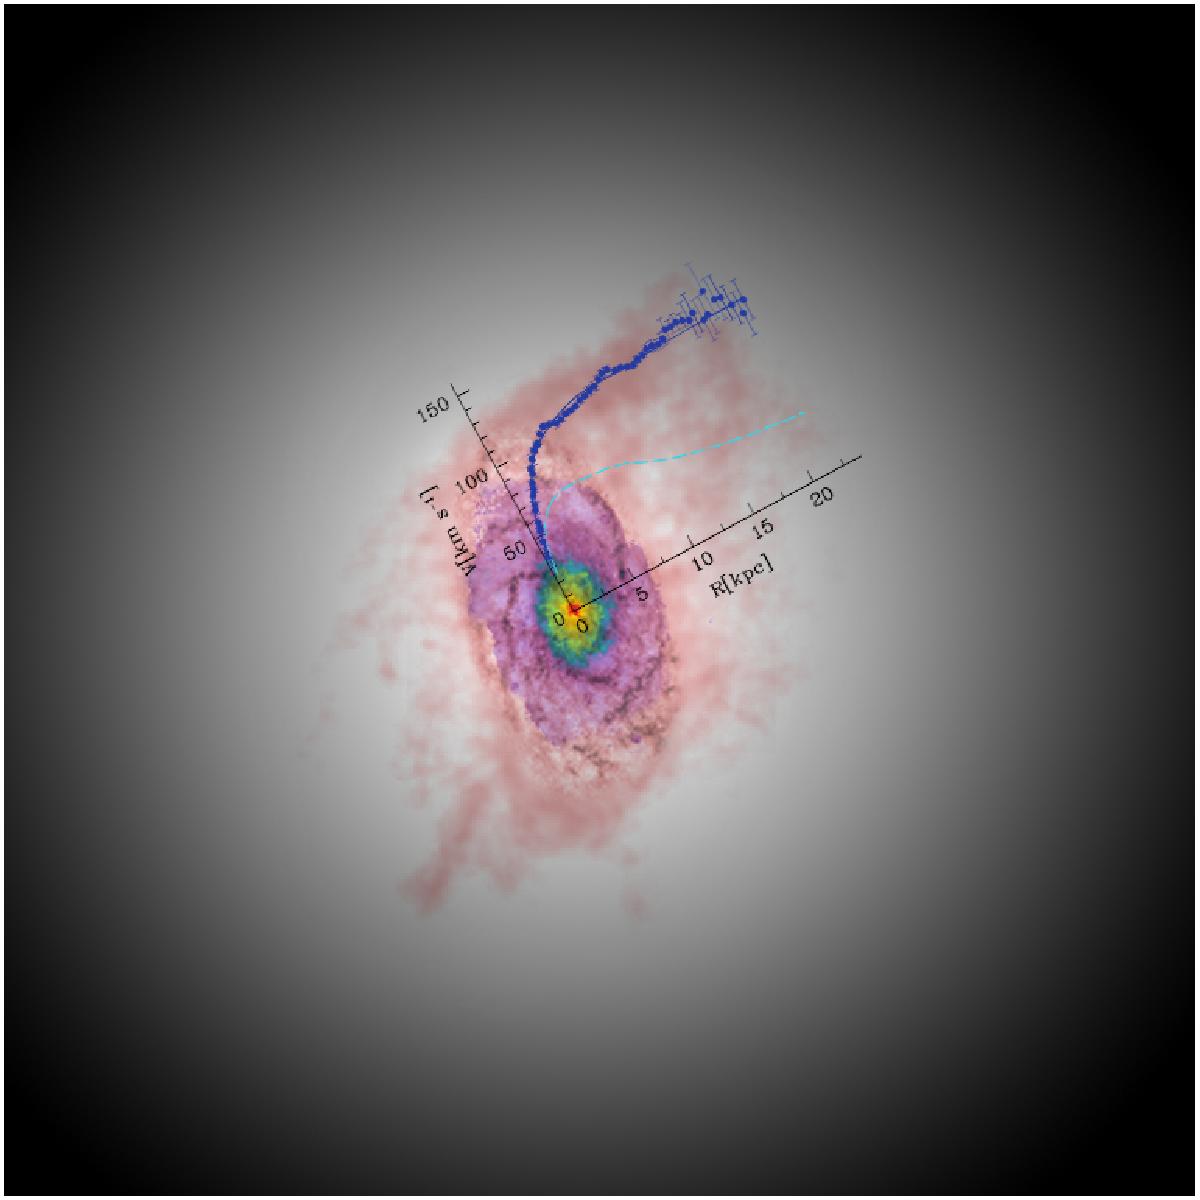
A naive view of M 33: inner stellar surface density (from red to magenta colors in the online version) superimposed on the HI gas distribution in log-scale (light pink) are shown together with the stellar+gas contribution to the rotation curve (dashed cyan line) and with observed rotation curve (filled dots, in blue). The analysis presented in this paper has pinned down the average dark matter density distribution in the halo (light gray) which explains the observed rotation curve. The figure extrapolates the halo beyond the region analyzed in this paper in a naive smooth fashion. The total mass model fit to the rotational data, through the region analyzed in this paper, is shown by the continuous blue line.
Current usage metrics show cumulative count of Article Views (full-text article views including HTML views, PDF and ePub downloads, according to the available data) and Abstracts Views on Vision4Press platform.
Data correspond to usage on the plateform after 2015. The current usage metrics is available 48-96 hours after online publication and is updated daily on week days.
Initial download of the metrics may take a while.