Fig. 14
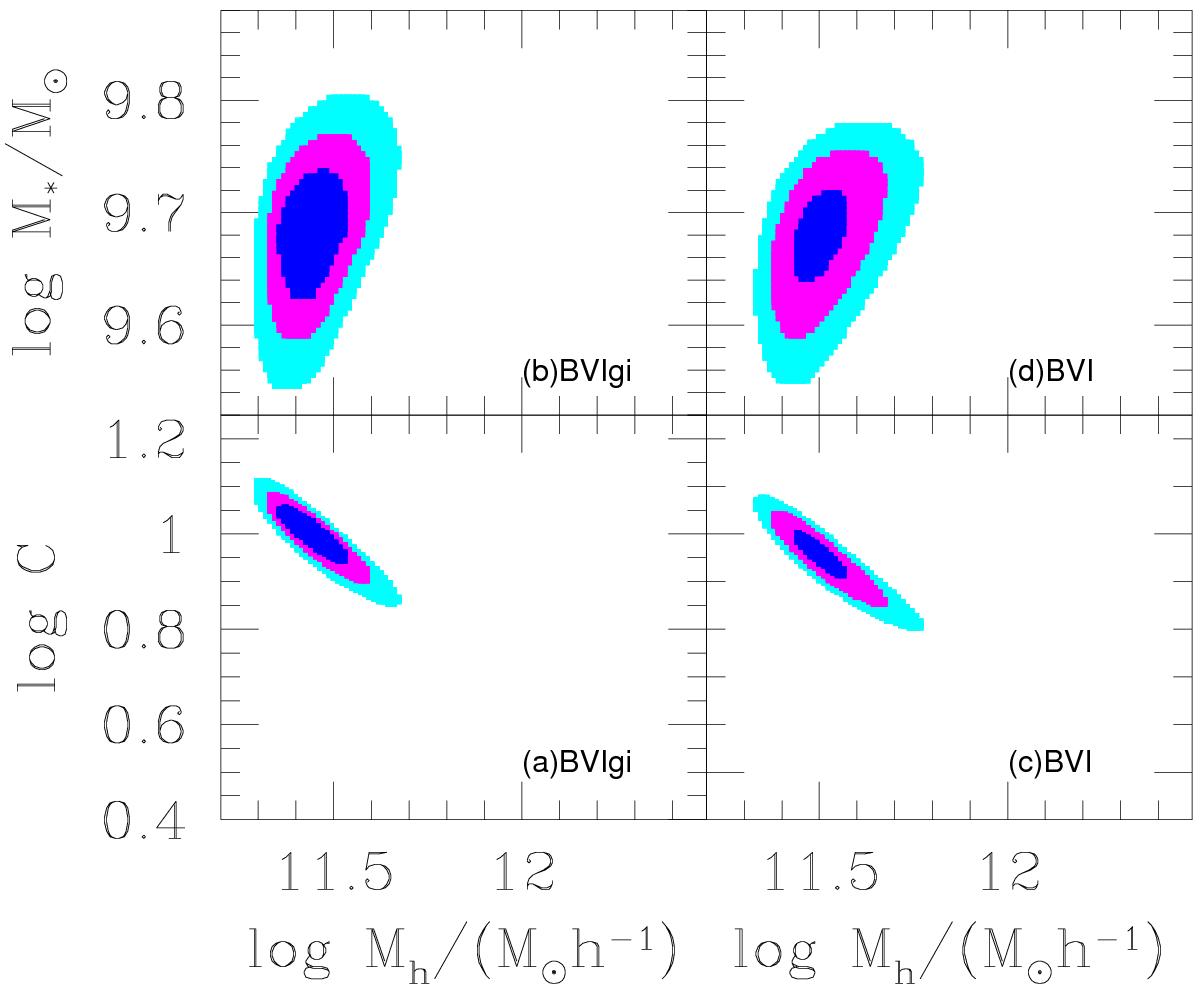
68.3% (darker regions, blue in the online version), 95.4% (magenta) and 99.7% (lighter regions, cyan) confidence areas in the log C − log Mh/h-1 plane and in the M∗ − Mh/h-1 plane when the probability of the dynamical fit is combined with the probability of the stellar mass surface density and of the C − Mh distribution from simulations of structure formation in a ΛCDM cosmology. The mass distribution is that given by the BVIgi map for the areas shown in a) and b), and by the BVI map for the areas in c) and d).
Current usage metrics show cumulative count of Article Views (full-text article views including HTML views, PDF and ePub downloads, according to the available data) and Abstracts Views on Vision4Press platform.
Data correspond to usage on the plateform after 2015. The current usage metrics is available 48-96 hours after online publication and is updated daily on week days.
Initial download of the metrics may take a while.