Fig. 12
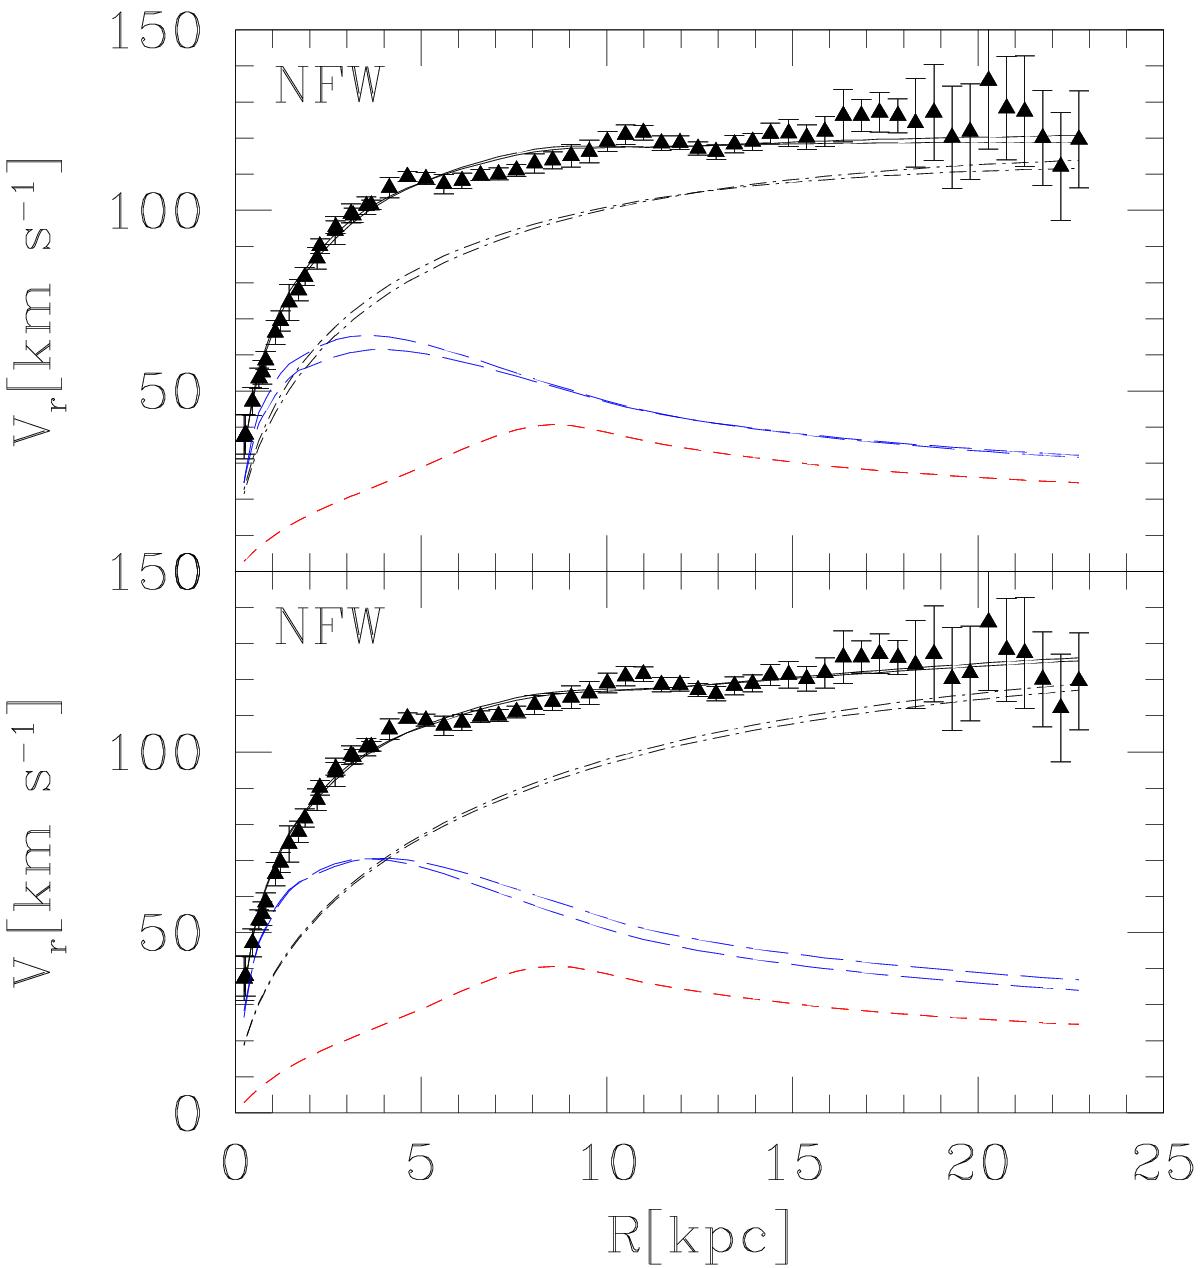
Rotation curve of M 33 (filled triangles) and best-fitting dynamical models (solid line) for NFW dark matter halo profiles (dot-dashed line). The small and large dashed lines (red and blue in the online version) show the gas and stellar disk contributions to the rotation curve, respectively. In the bottom panel, the highest stellar contribution and lowest dark halo curve are for the best-fitting dynamical model using the BVIgi mass map, the other curves are for the BVI mass map. The top panel shows the most likely dynamical models for the two mass maps when the likelihood of the dynamical fit is combined with that of the stellar mass surface density and of the C − Mh relation resulting from simulations of structure formation in a ΛCDM cosmology.
Current usage metrics show cumulative count of Article Views (full-text article views including HTML views, PDF and ePub downloads, according to the available data) and Abstracts Views on Vision4Press platform.
Data correspond to usage on the plateform after 2015. The current usage metrics is available 48-96 hours after online publication and is updated daily on week days.
Initial download of the metrics may take a while.