Fig. 10
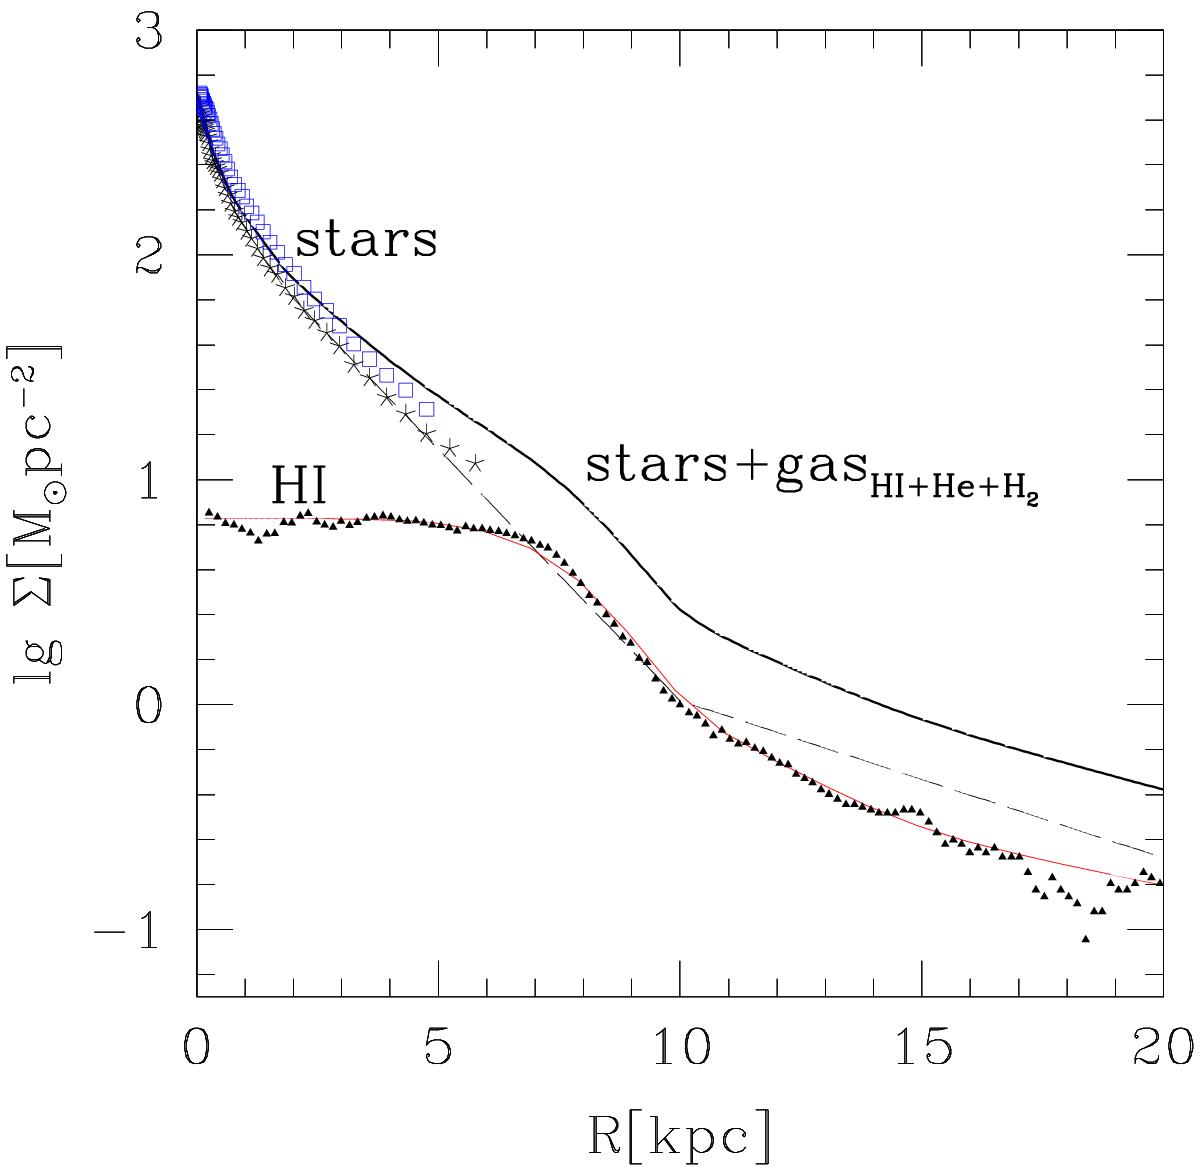
Neutral atomic gas surface density perpendicular to the galactic plane of M 33 (small filled triangles) and the function that fits the data (continuous line,red in the online version) after the 21 cm line intensity has been deconvolved according to tilted ring model-shape. Asterisk symbols indicate the stellar mass surface density using the BVIgi stellar surface density map. The dashed line is the fit to the stellar surface density and the extrapolation to larger radii. Open squares(in blue in the online version) show for comparison the surface density using the BVI mass map. The heavy weighted line is the total baryonic surface density, the sum of atomic and molecular hydrogen, helium and stellar mass surface density.
Current usage metrics show cumulative count of Article Views (full-text article views including HTML views, PDF and ePub downloads, according to the available data) and Abstracts Views on Vision4Press platform.
Data correspond to usage on the plateform after 2015. The current usage metrics is available 48-96 hours after online publication and is updated daily on week days.
Initial download of the metrics may take a while.