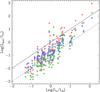
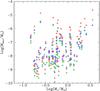
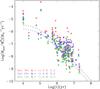
Fig. 8
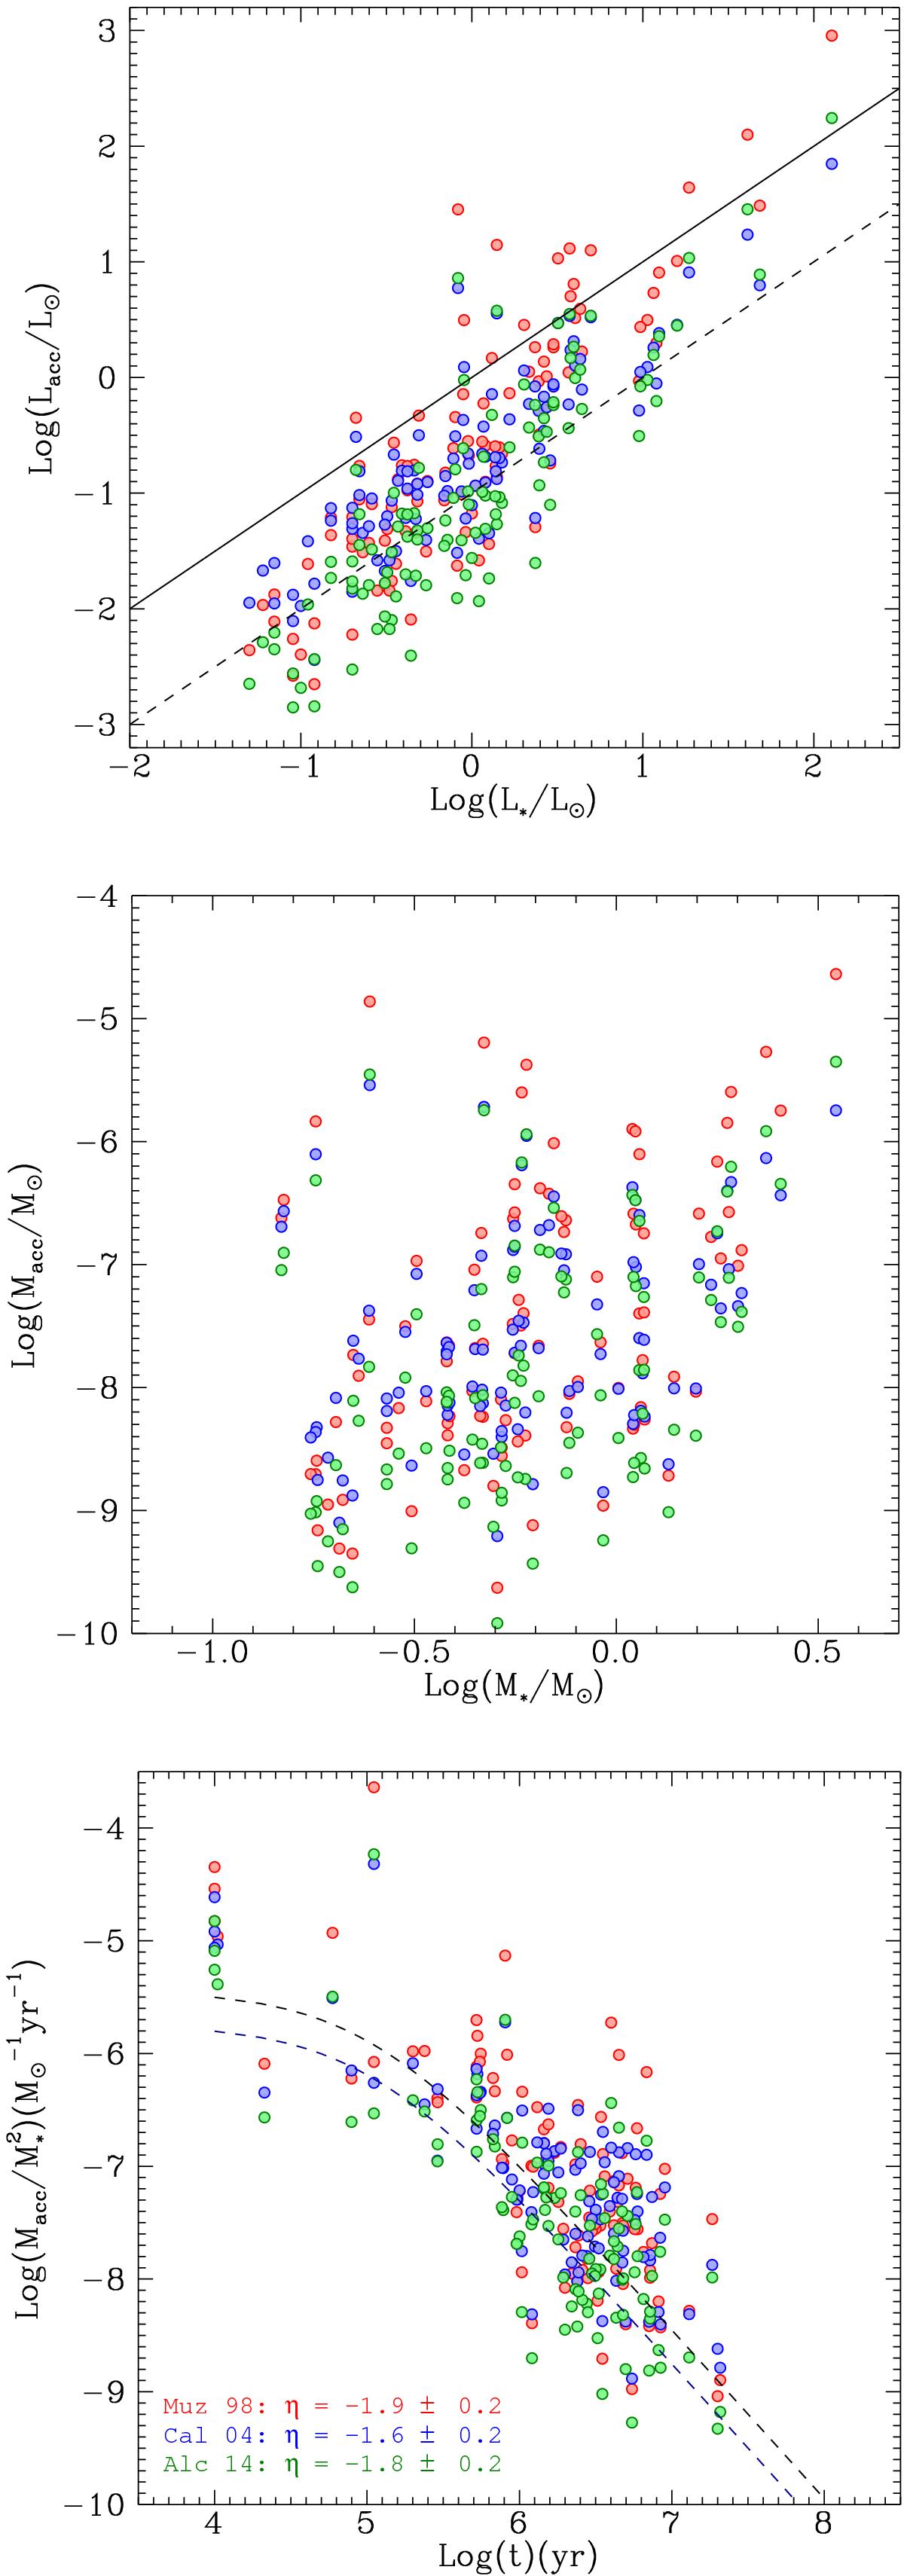
Results obtained by considering Lacc values from three different empirical relationships for Brγ: Alcalá et al. (2014; green), Muzerolle et al. (1998; red), and Calvet et al. (2004; blue). Displayed plots are Lacc versus L∗ (top), Ṁacc versus M∗ (centre), and Ṁacc normalised to M∗2 versus age (bottom). In the last plot we report the curves of the viscous disk model of Hartmann et al. (1998) shown in Figs. 6 and 7; the best-fit power-law indexes obtained from the different distributions for sources with Log t> 5.9 (see text for details) are also indicated.
Current usage metrics show cumulative count of Article Views (full-text article views including HTML views, PDF and ePub downloads, according to the available data) and Abstracts Views on Vision4Press platform.
Data correspond to usage on the plateform after 2015. The current usage metrics is available 48-96 hours after online publication and is updated daily on week days.
Initial download of the metrics may take a while.