Fig. 7
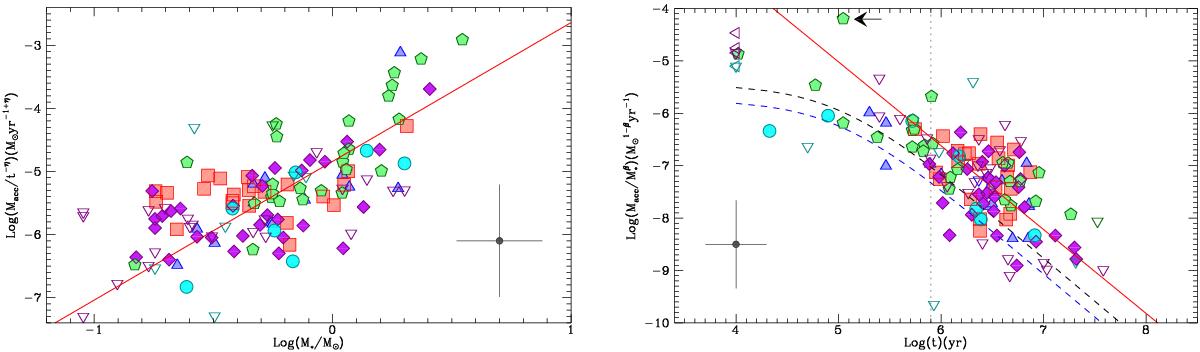
Same as in Fig. 6, but for normalised data: Ṁacc normalised by the time factor provided by Hartmann et al. (1998)Ṁacc evolution models (~ t− η, see text) vs. M∗ (right) and Ṁacc normalised by M∗β vs. age (right; Ṁacc evolution curves by Hartmann et al. are also normalised). The best-fit relationships we obtain are indicated with a solid red line and correspond to power-law indexes β = 2.2 (left) and η = 1.6 (right). The vertical dotted line in the right graph shows the lower limit on age that we considered for the fit of the power-law decrement. The position of the outbursting source V2775 Ori (Paper II, Caratti o Garatti et al. 2011) is marked by an arrow in the temporal evolution plot.
Current usage metrics show cumulative count of Article Views (full-text article views including HTML views, PDF and ePub downloads, according to the available data) and Abstracts Views on Vision4Press platform.
Data correspond to usage on the plateform after 2015. The current usage metrics is available 48-96 hours after online publication and is updated daily on week days.
Initial download of the metrics may take a while.