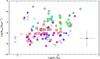
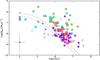
Fig. 6

Mass accretion rates of the whole POISSON sample plotted as a function of the stellar mass (left) and age of the targets (right). Upper limits on Ṁacc are indicated by downward triangles. The typical error bar of a single point is also shown. The dashed lines in the right graph show the expected Ṁacc evolution for a fiducial model of a viscous disk (Hartmann et al. 1998; see text for more details) around a 0.5 M⊙ star with initial disk masses equal to 0.1 M⊙ (lower line) and 0.2 M⊙ (upper line). Sample symbols are the same as in Fig. 4.
Current usage metrics show cumulative count of Article Views (full-text article views including HTML views, PDF and ePub downloads, according to the available data) and Abstracts Views on Vision4Press platform.
Data correspond to usage on the plateform after 2015. The current usage metrics is available 48-96 hours after online publication and is updated daily on week days.
Initial download of the metrics may take a while.