Fig. 10
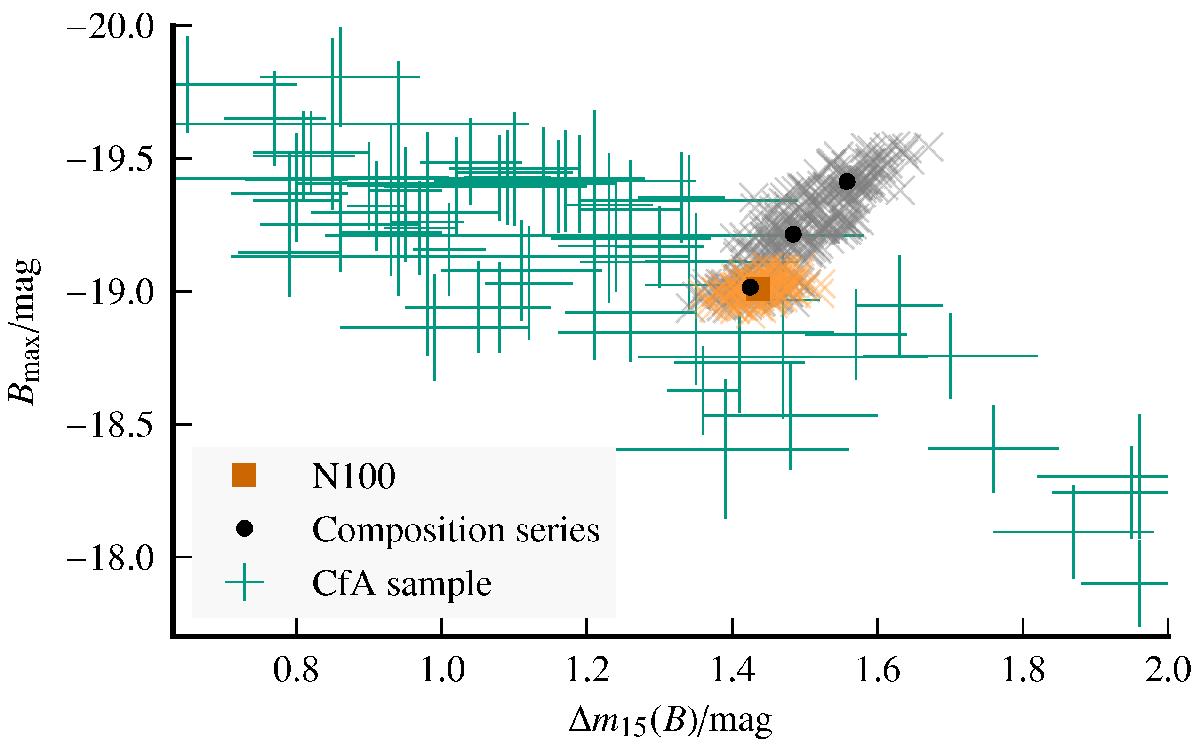
Light curve width-luminosity relation for a series of models with differing C depletion in the core, but otherwise identical parameters (in black: models rpc32_DDT8_N100, rpc40_DDT8_N100, and c50_DDT8_N100 with increasing Bmax in this order) as well as for the N100 model of Seitenzahl et al. (2013, in gold). The dots and the square denote angle-averaged values, pale crosses denote values for different lines of sight. The green crosses show observed supernovae from the CfA sample (Hicken et al. 2009).
Current usage metrics show cumulative count of Article Views (full-text article views including HTML views, PDF and ePub downloads, according to the available data) and Abstracts Views on Vision4Press platform.
Data correspond to usage on the plateform after 2015. The current usage metrics is available 48-96 hours after online publication and is updated daily on week days.
Initial download of the metrics may take a while.