Fig. 10
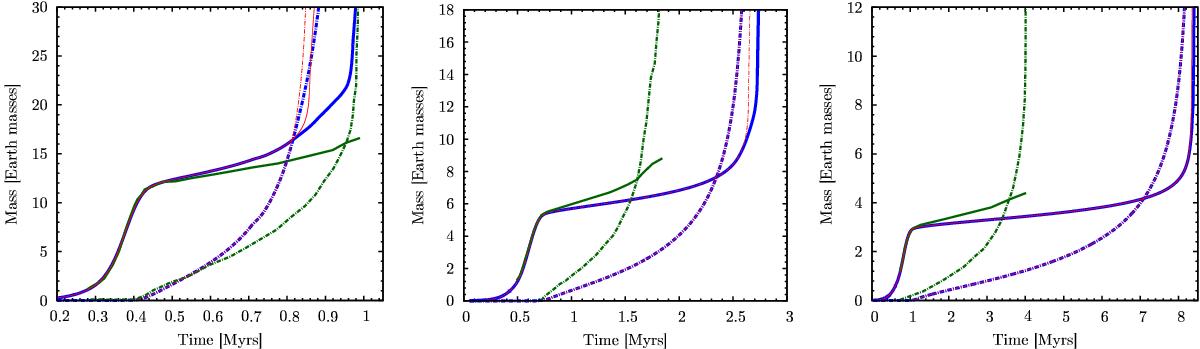
Core (solid line) and envelope mass (dash-dotted line) as a function of time for Jupiter in situ formation. The panels show the results for an initial planetesimal surface density of 10 (left), 6 (middle), and 4 g/cm2 (right). The thick blue lines are calculated with the analytical model for the grain opacity, while the thinner green lines are from the numerical model of MBPL10. The thin red lines are also from the analytical model, but without taking the advection regime into account.
Current usage metrics show cumulative count of Article Views (full-text article views including HTML views, PDF and ePub downloads, according to the available data) and Abstracts Views on Vision4Press platform.
Data correspond to usage on the plateform after 2015. The current usage metrics is available 48-96 hours after online publication and is updated daily on week days.
Initial download of the metrics may take a while.