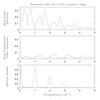
Fig. 3
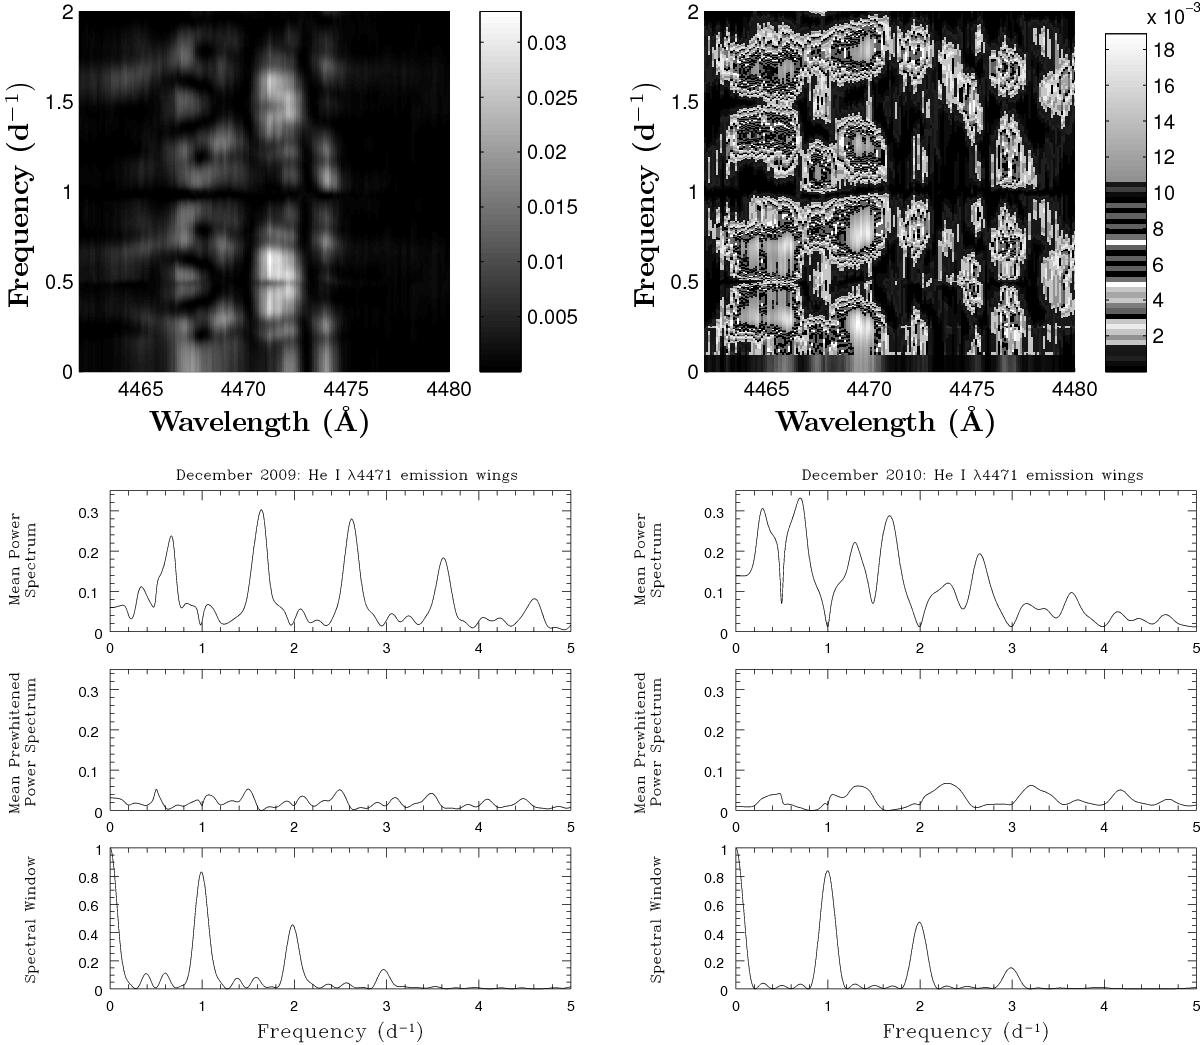
Fourier power spectra of the 2009 (left) and 2010 (right) time series of the secondary’s He i λ 4471 line. The top panels of each row show the full 2D periodograms (between 0 and 2 d-1), whilst the second and third panels illustrate the mean periodogram over the emission humps, respectively before and after prewhitening (see text). The spectral window is shown in the lower panel.
Current usage metrics show cumulative count of Article Views (full-text article views including HTML views, PDF and ePub downloads, according to the available data) and Abstracts Views on Vision4Press platform.
Data correspond to usage on the plateform after 2015. The current usage metrics is available 48-96 hours after online publication and is updated daily on week days.
Initial download of the metrics may take a while.