Fig. 2
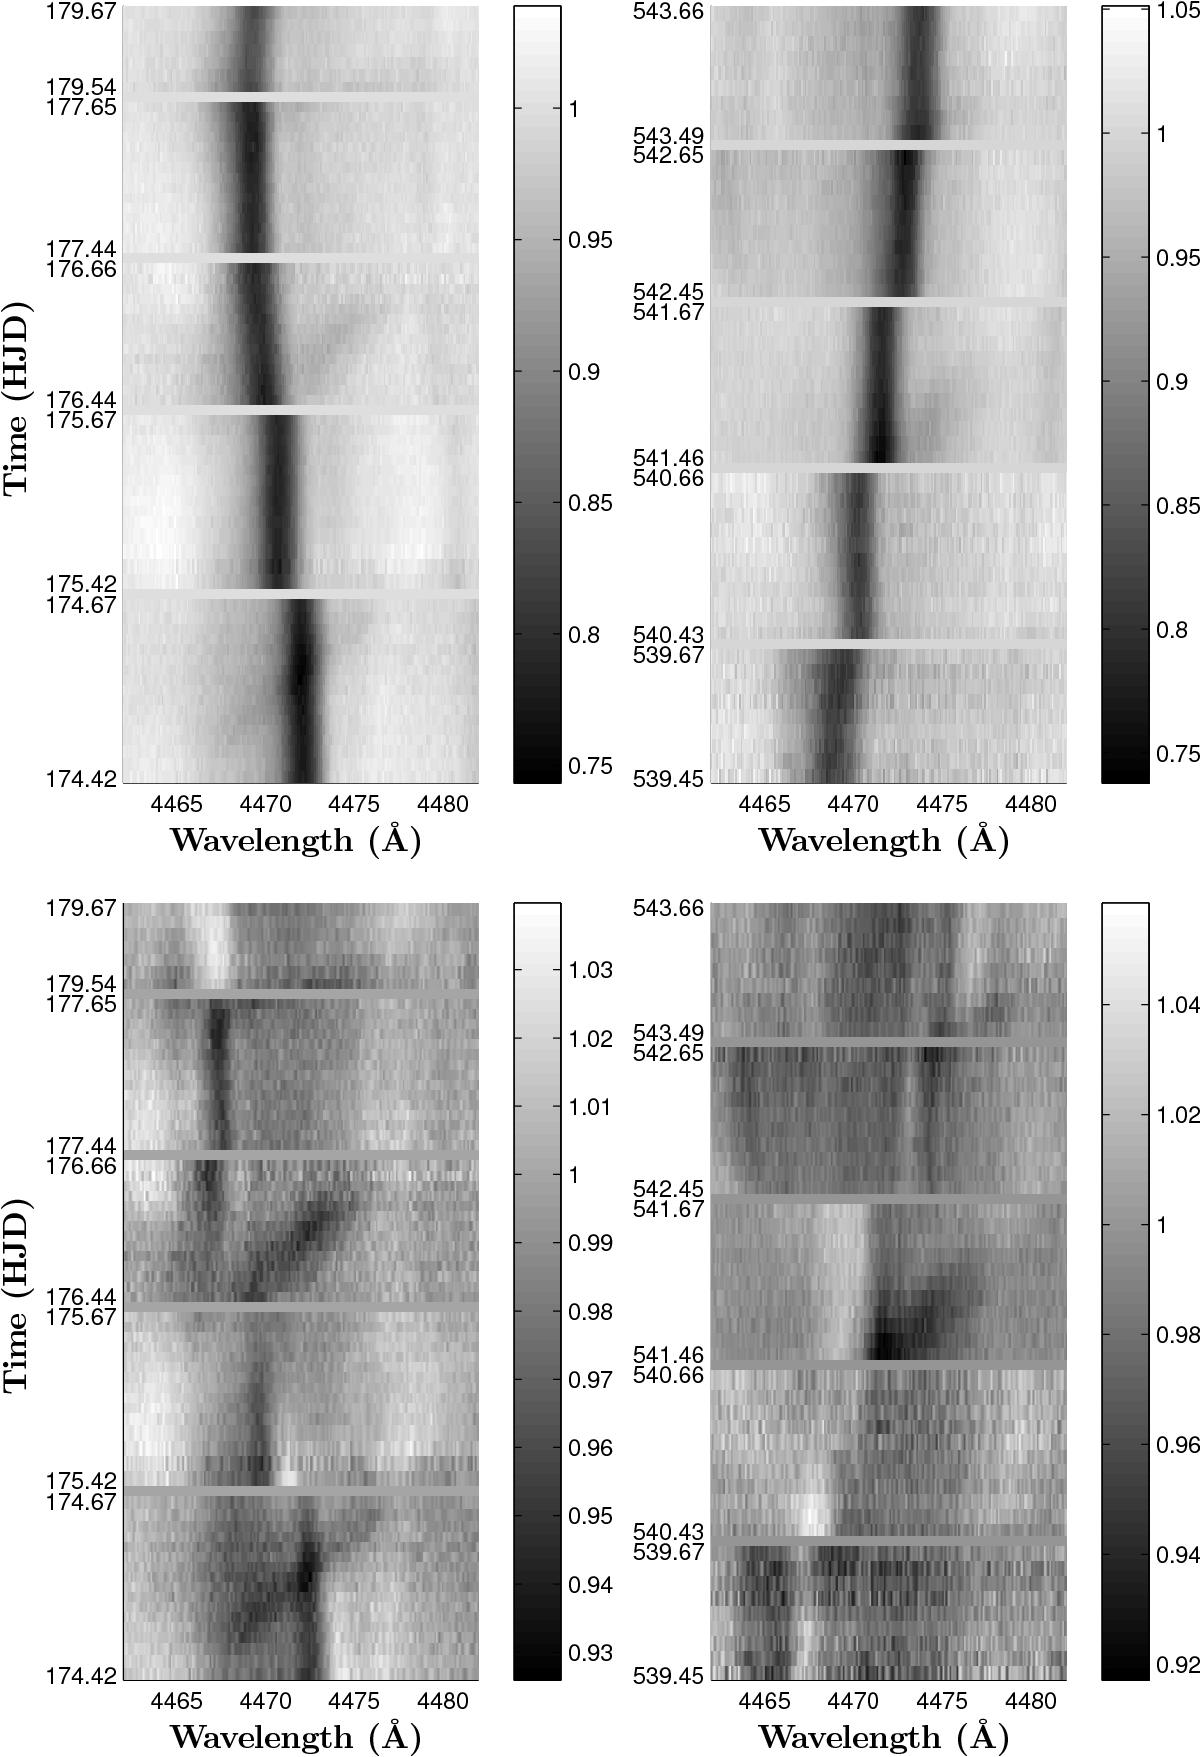
Line-profile variations in the He i λ 4471 line in the 2009 (left) and 2010 (right) campaigns. The top panels show the dynamic spectra of the observed data in the heliocentric frame of reference. The bottom panels yield the secondary dynamic spectra. The labels on the vertical axis indicate the date of the first and last observation of each night in the format HJD − 2 455 000.
Current usage metrics show cumulative count of Article Views (full-text article views including HTML views, PDF and ePub downloads, according to the available data) and Abstracts Views on Vision4Press platform.
Data correspond to usage on the plateform after 2015. The current usage metrics is available 48-96 hours after online publication and is updated daily on week days.
Initial download of the metrics may take a while.