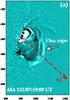
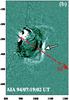
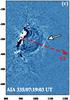
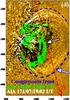
Fig. 7
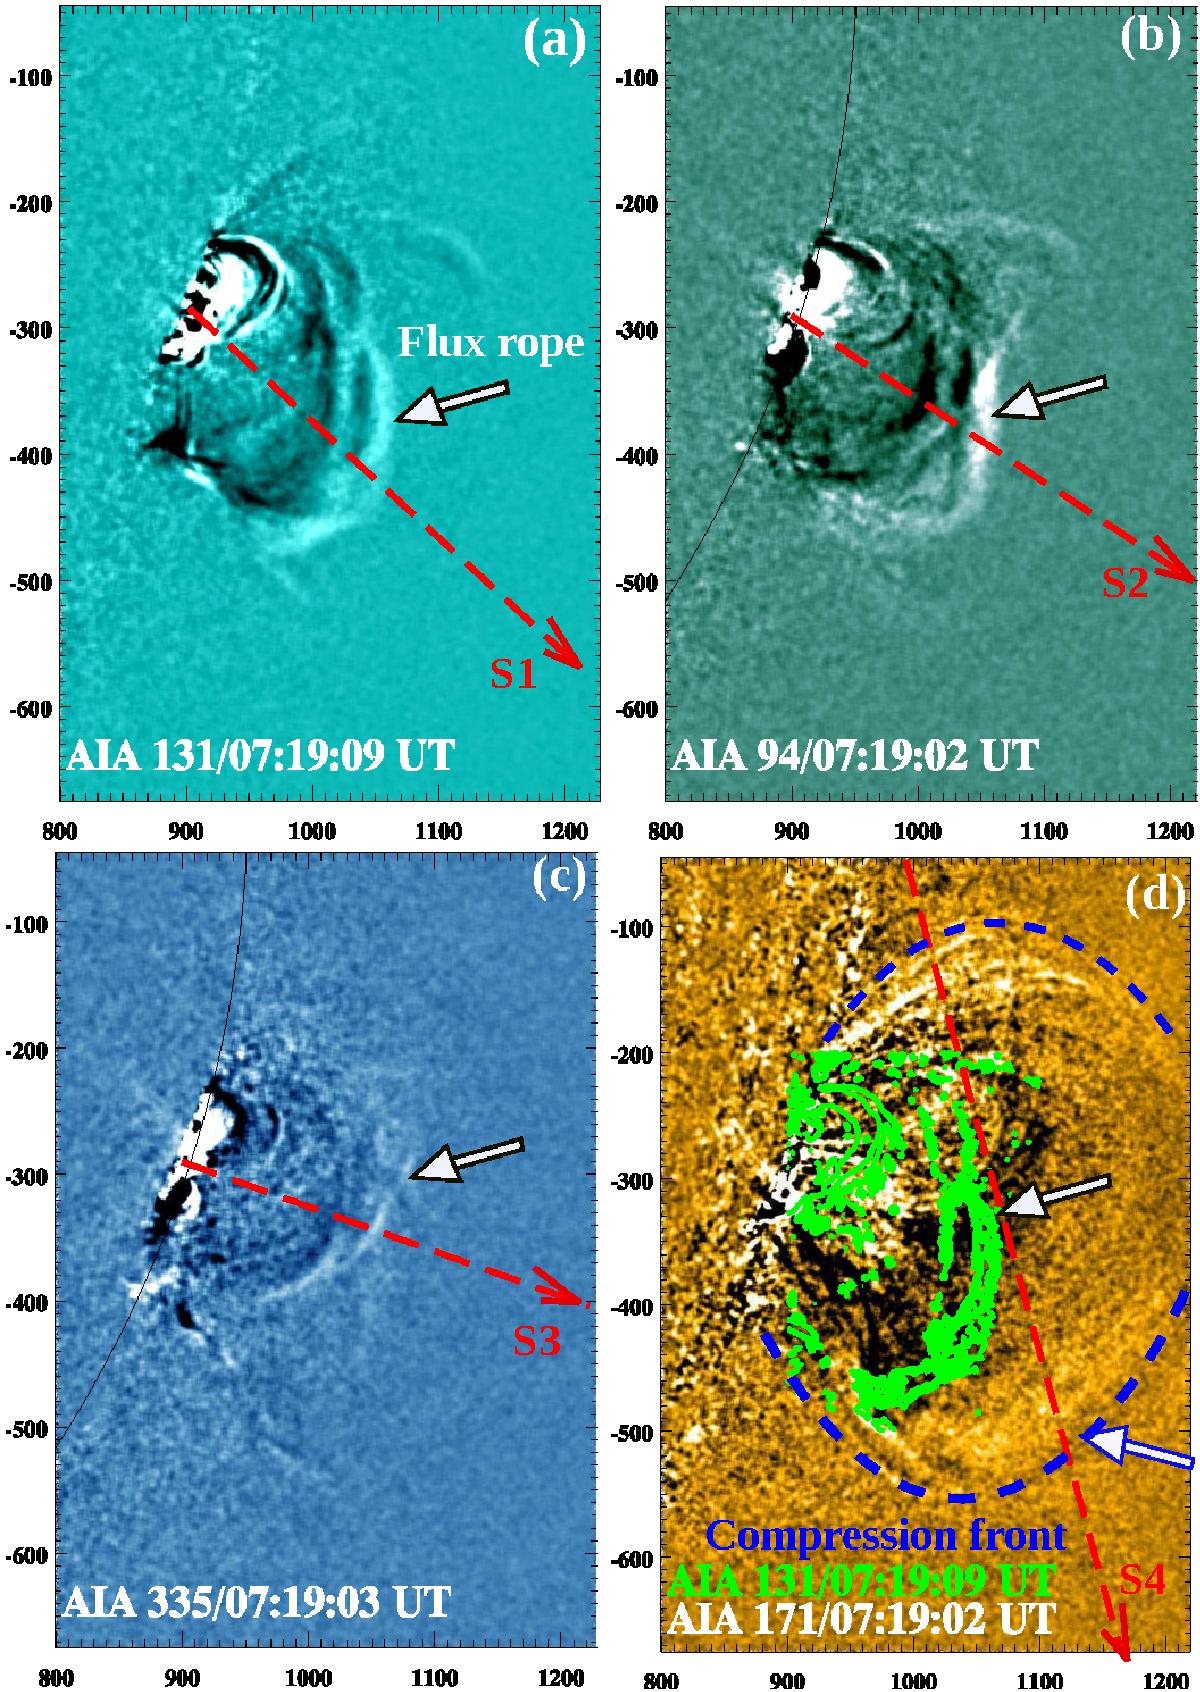
SDO/AIA running difference images in the 131, 94, 335, and 171 Å channels showing the flux rope eruption. S1, S2, S3, and S4 are the slice cuts used for the stack plots. The flux rope contours (green) of AIA 131 Å are overlaid on the AIA 171 Å image (panel d)). The blue dotted curve in AIA 171 Å indicates the cool compression front of the CME. The temporal evolution of the flux rope and the associated flare in 131, 94, 335, and 171 Å can be found in the online movie.
Current usage metrics show cumulative count of Article Views (full-text article views including HTML views, PDF and ePub downloads, according to the available data) and Abstracts Views on Vision4Press platform.
Data correspond to usage on the plateform after 2015. The current usage metrics is available 48-96 hours after online publication and is updated daily on week days.
Initial download of the metrics may take a while.