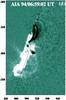
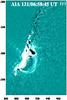
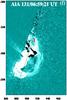
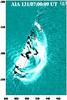
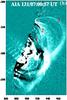
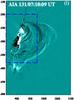
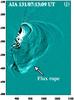
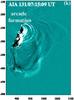
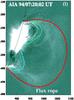
Fig. 5
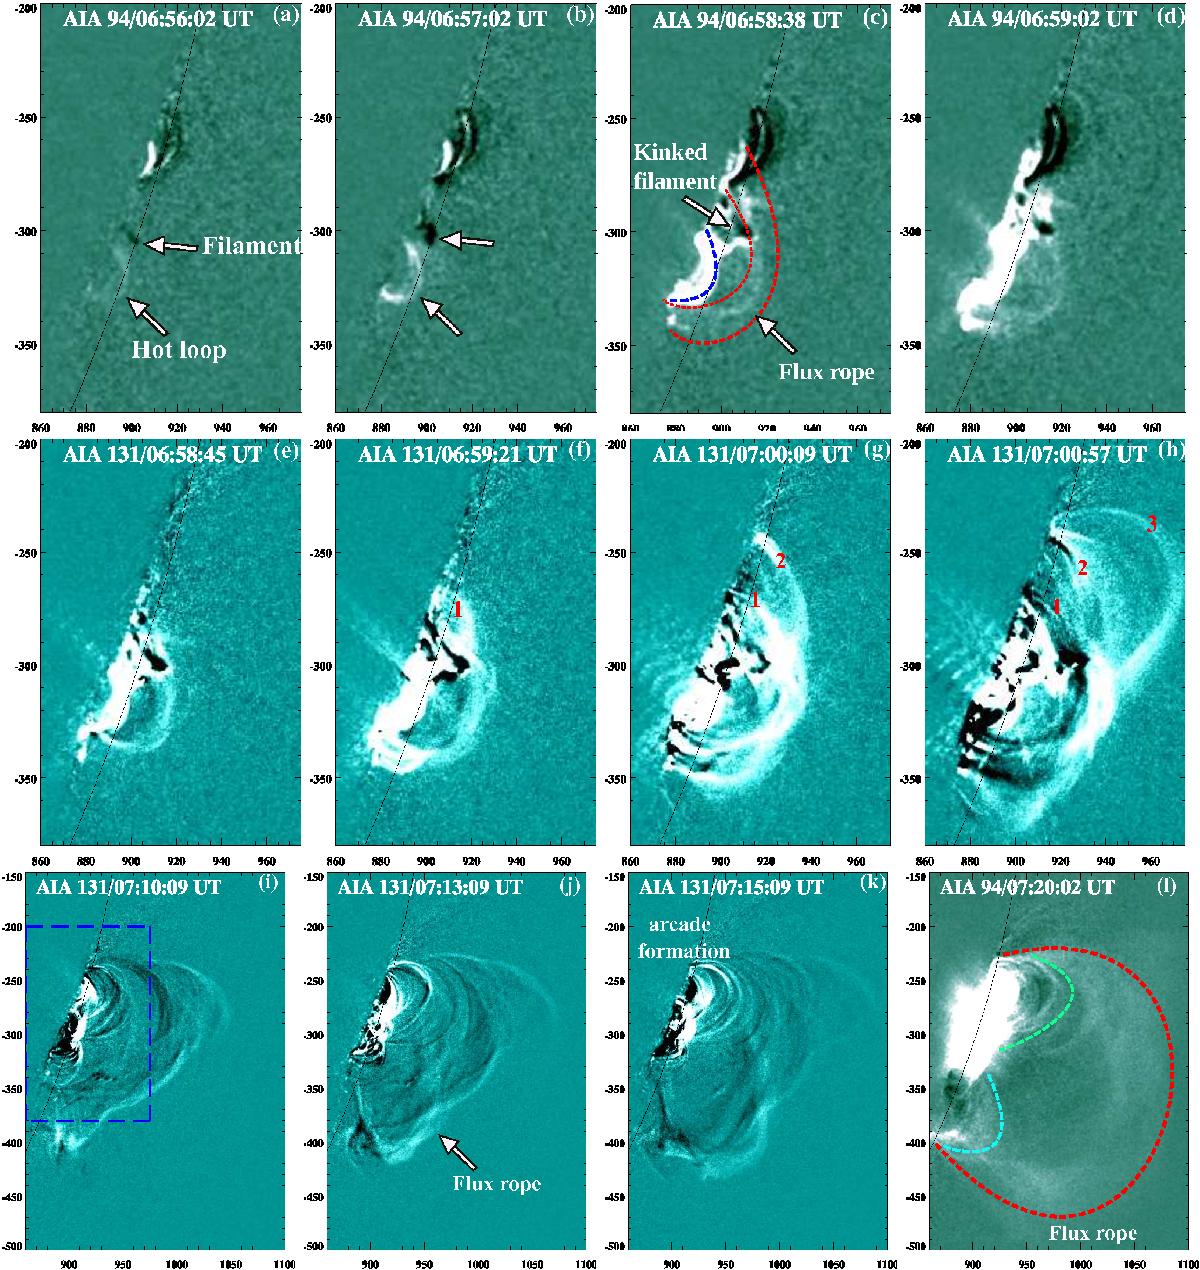
SDO/AIA 94 Å base difference and 131 Å running-difference images showing the formation and ejection of the twisted flux rope above the kinked filament during magnetic reconnection. The red dotted curve shows the flux rope, the other curves indicate the underlying closed loops (panels c) and l)). The blue rectangle (panel i)) represents the size of the upper panels.
Current usage metrics show cumulative count of Article Views (full-text article views including HTML views, PDF and ePub downloads, according to the available data) and Abstracts Views on Vision4Press platform.
Data correspond to usage on the plateform after 2015. The current usage metrics is available 48-96 hours after online publication and is updated daily on week days.
Initial download of the metrics may take a while.