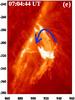
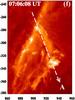
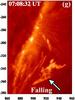
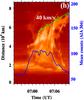
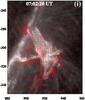
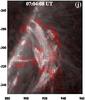
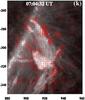
Fig. 2
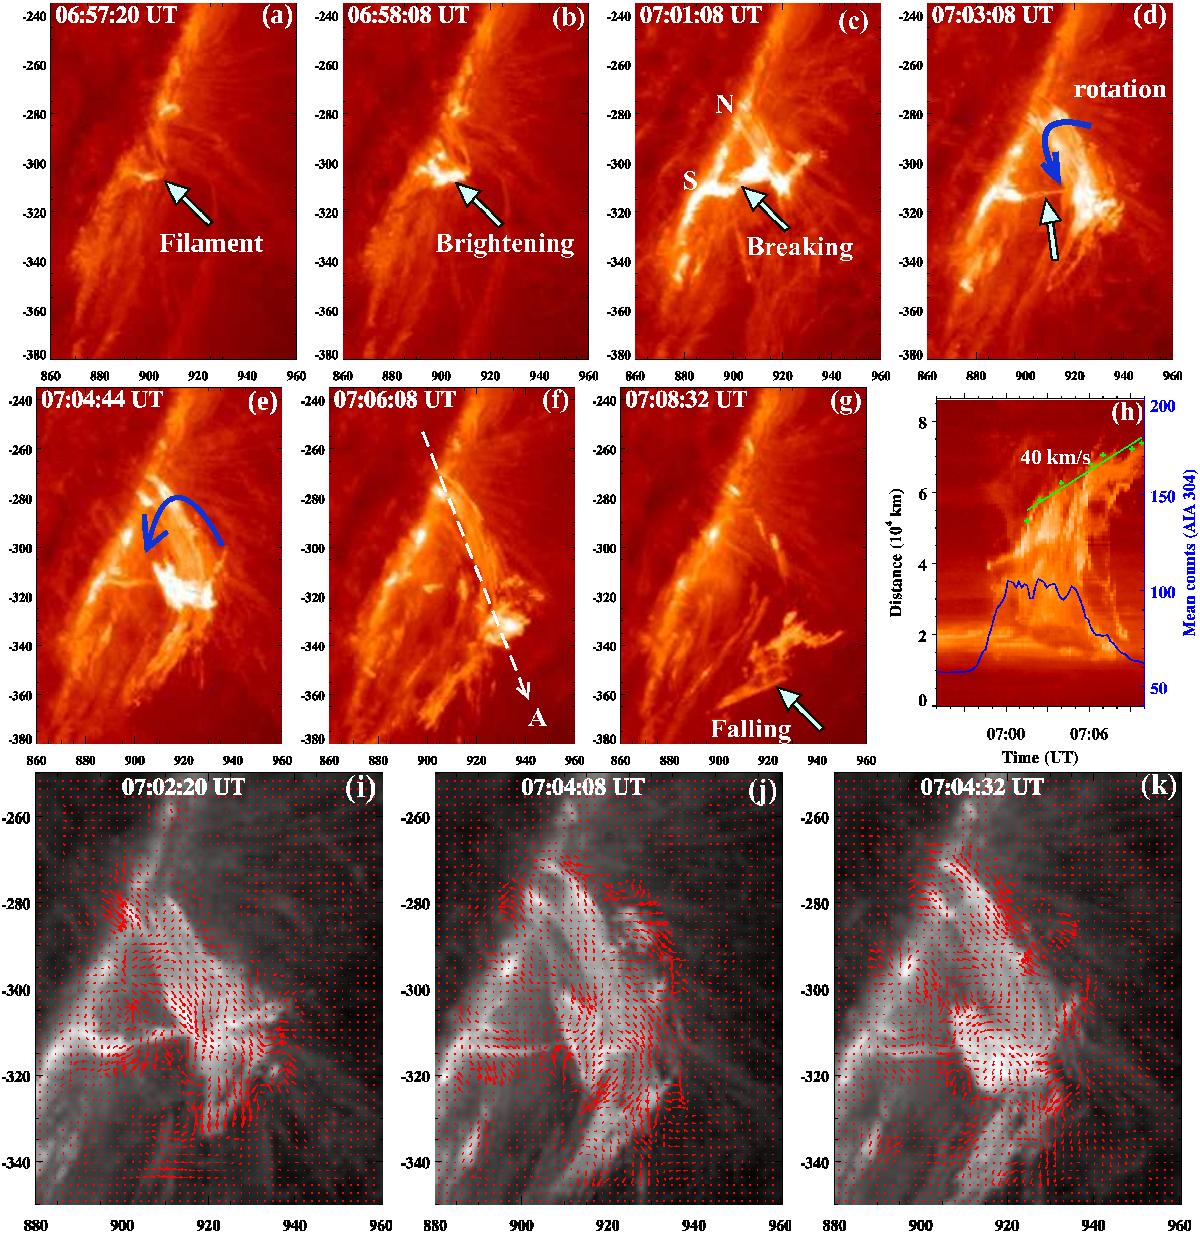
a)−g) SDO/AIA EUV images in the 304 Å channel (T ~ 0.05 MK) showing the eruption of a kinked small filament associated with the C3.9 flare on 30 April 2012. N and S represent the northern and southern legs of the filament. The blue arrows show the unwinding motion of the northern leg and the top portion of the filament. X and Y axes are in arcsecs. h) Space-time plot along the slice A (shown by the dotted line in panel f)) plotted with AIA 304 Å mean counts in blue curve. i)−k) Apparent velocity field computed with DAVE using AIA 304 Å images, showing the plasma flows in and around the prominence threads. The longest arrow (in the panels) corresponds to a speed of i) 204 km s-1, j) 178 km s-1, and k) 158 km s-1. The temporal evolution of the kinked filament in 304 Å can be found in the online movie.

Current usage metrics show cumulative count of Article Views (full-text article views including HTML views, PDF and ePub downloads, according to the available data) and Abstracts Views on Vision4Press platform.
Data correspond to usage on the plateform after 2015. The current usage metrics is available 48-96 hours after online publication and is updated daily on week days.
Initial download of the metrics may take a while.