Fig. 12
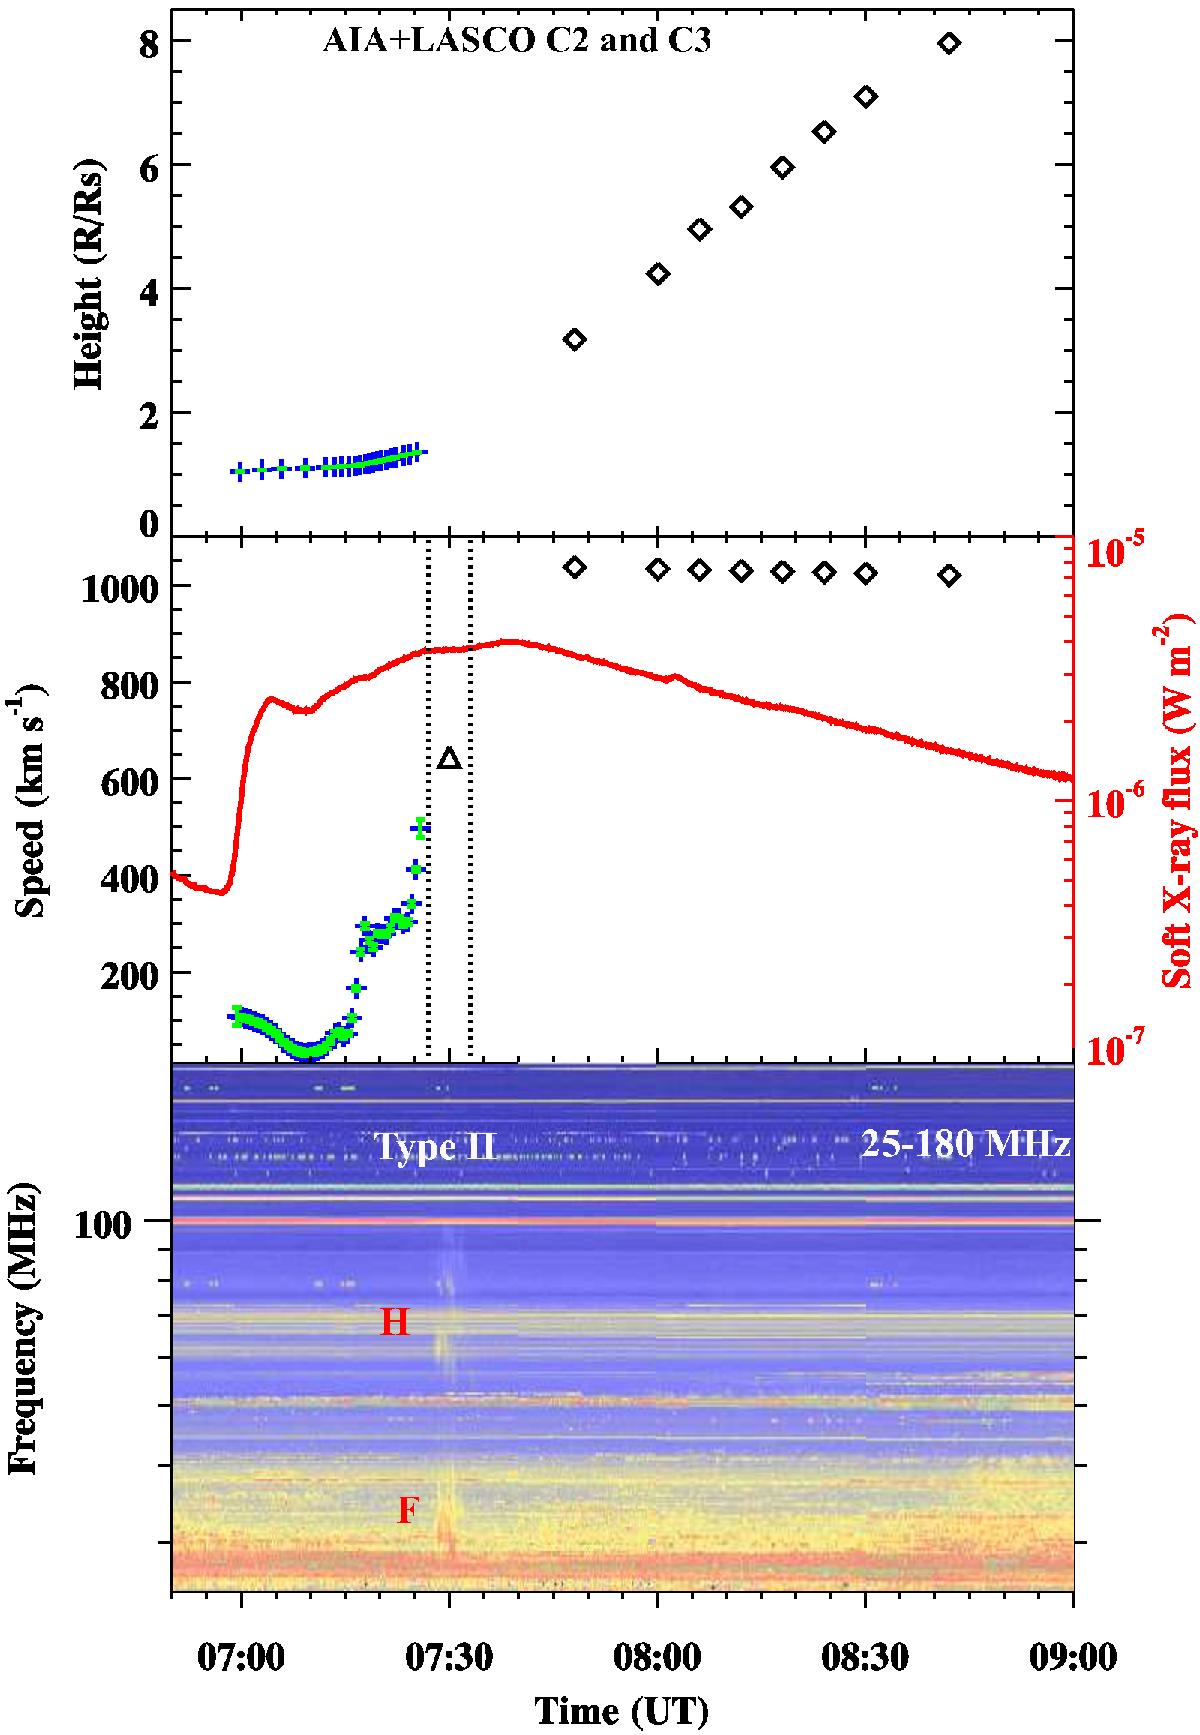
Top: height-time profile of the flux rope and CME frontal loop (diamond symbol) from AIA 94 Å and LASCO C2/C3. Middle: speed of the flux rope and the CME frontal loop, plotted with GOES soft X-ray profile (red curve). The triangle symbol (between two vertical dotted lines) shows the speed of the type II radio burst excitor. Bottom: dynamic radio spectrum (25−180 MHz) from Learmonth radio observatory. F and H represent the fundamental and second harmonic emissions of the type II radio burst.
Current usage metrics show cumulative count of Article Views (full-text article views including HTML views, PDF and ePub downloads, according to the available data) and Abstracts Views on Vision4Press platform.
Data correspond to usage on the plateform after 2015. The current usage metrics is available 48-96 hours after online publication and is updated daily on week days.
Initial download of the metrics may take a while.