Free Access
Fig. 11
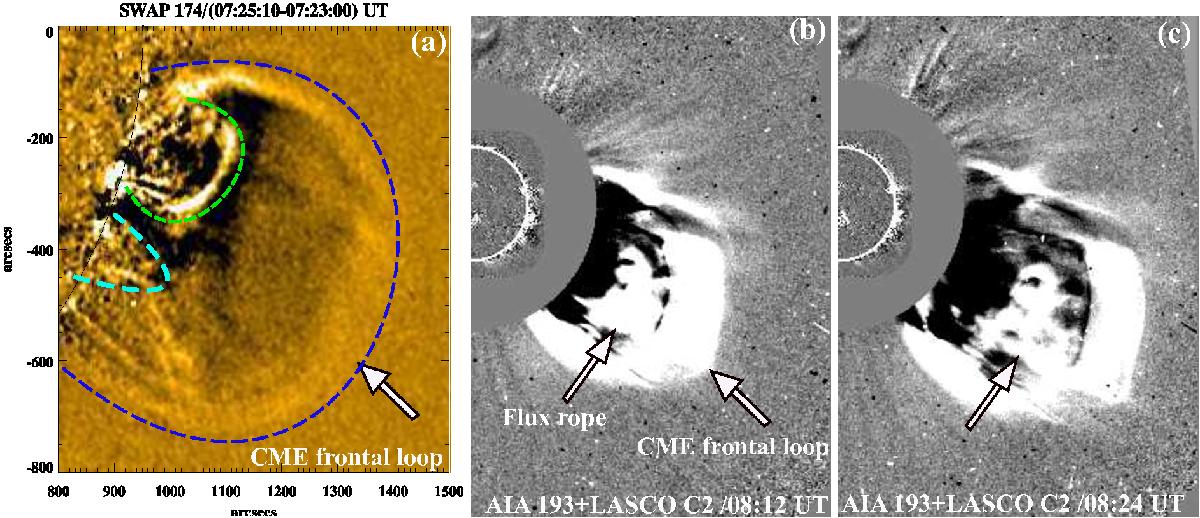
a) SWAP 174 Å running-difference image showing the compression front of the CME (blue dotted curve) and underlying loop systems (dotted curves). b)−c) AIA 193 Å and LASCO C2 composite running-difference images. The flux rope and the CME frontal loop are shown by arrows.
This figure is made of several images, please see below:
Current usage metrics show cumulative count of Article Views (full-text article views including HTML views, PDF and ePub downloads, according to the available data) and Abstracts Views on Vision4Press platform.
Data correspond to usage on the plateform after 2015. The current usage metrics is available 48-96 hours after online publication and is updated daily on week days.
Initial download of the metrics may take a while.