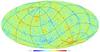
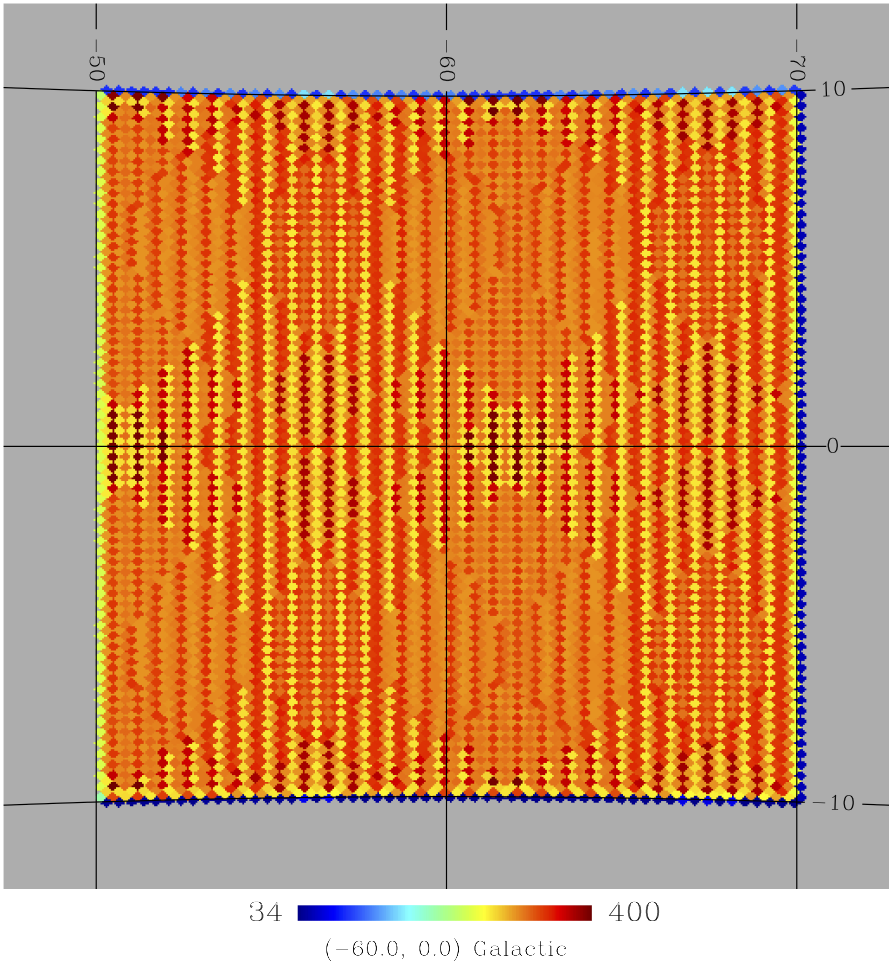
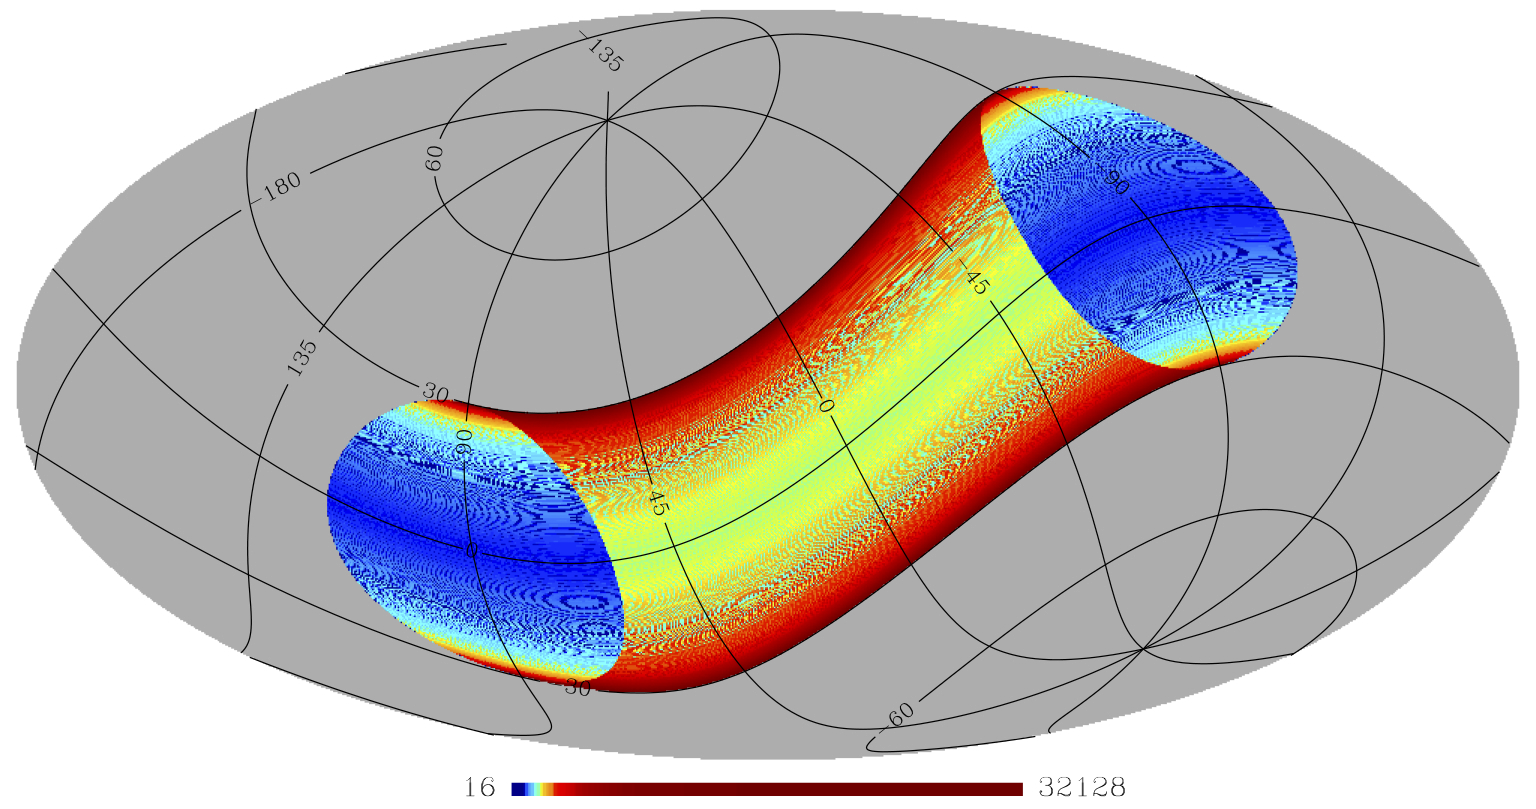
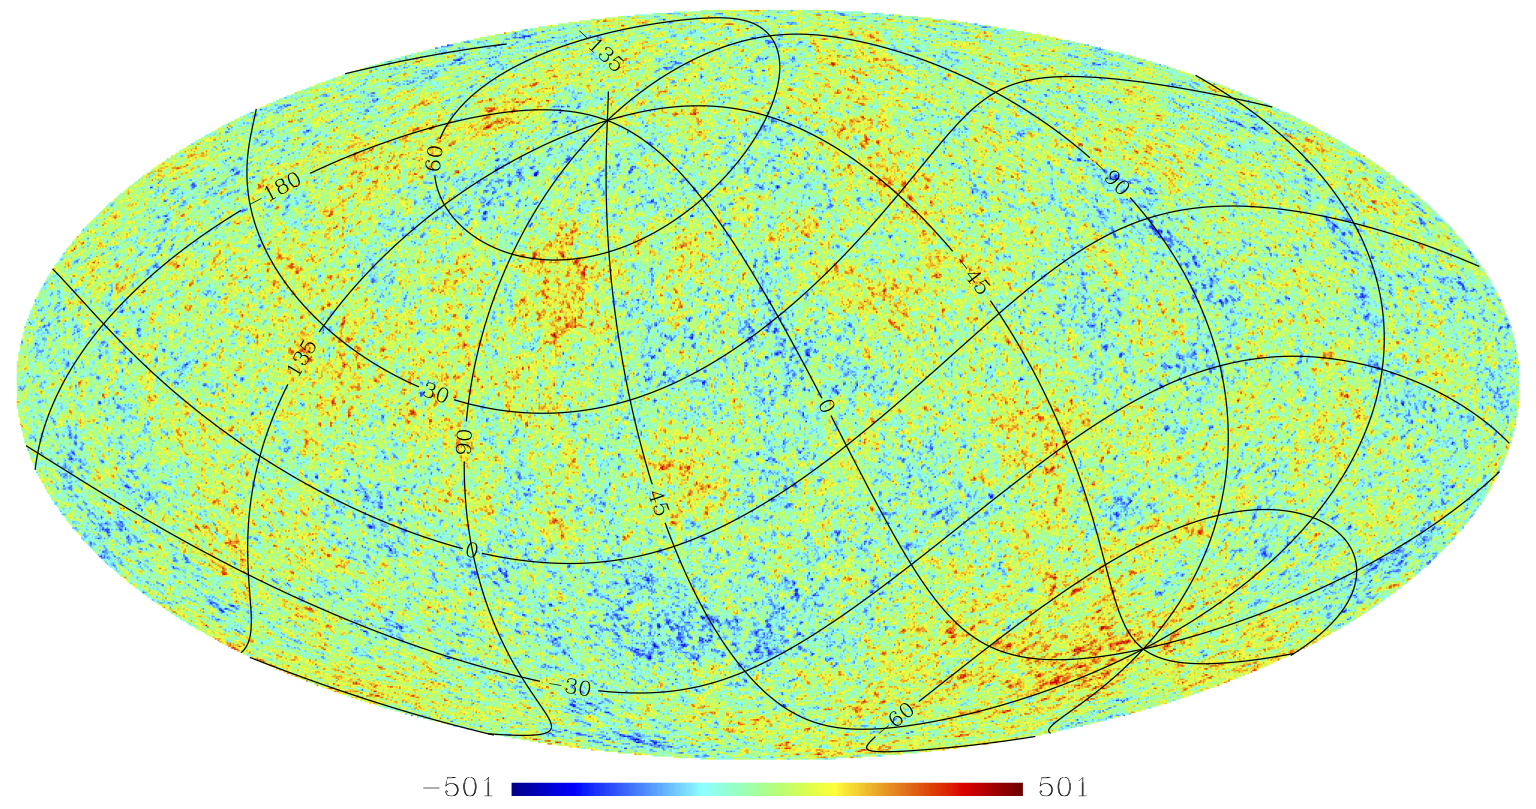
Fig. 2
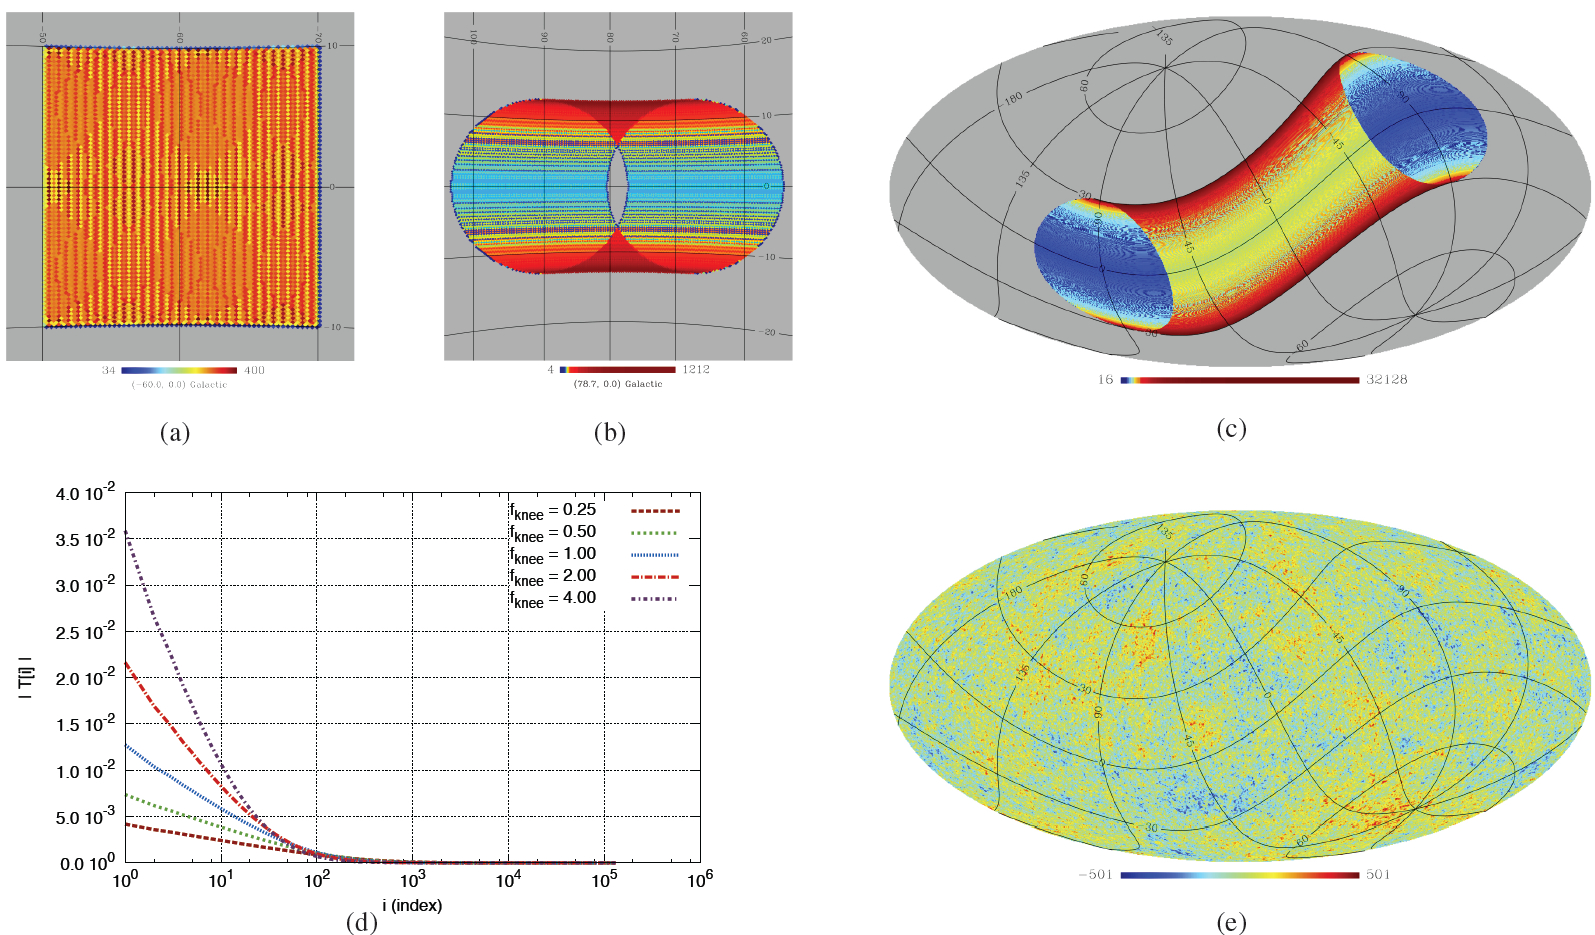
Visualisation of the input information used for the simulations (see Sect. 4.1 for more details). Upper row: panels a)-c), hit maps obtained for the grid-like, small circle, and big circle scans, respectively. Bottom row: d) noise correlations assumed for the stationary intervals and corresponding to different values of the knee frequency fknee, (the diagonal, highly dominant element is not shown to emphasise the off-diagonal correlations), e) an example of the total intensity map of the CMB fluctuations.

Current usage metrics show cumulative count of Article Views (full-text article views including HTML views, PDF and ePub downloads, according to the available data) and Abstracts Views on Vision4Press platform.
Data correspond to usage on the plateform after 2015. The current usage metrics is available 48-96 hours after online publication and is updated daily on week days.
Initial download of the metrics may take a while.