Fig. D.1
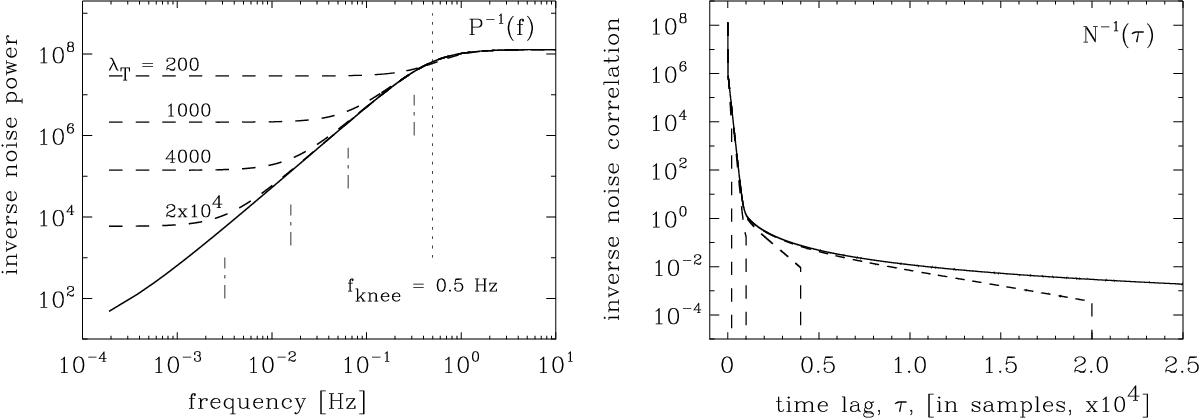
Effects of imposing band-diagonality on the inverse noise correlation matrix, N-1, right panel, and its consequences for the inverse noise power spectrum, P(f), left panel. The apodization kernel used here is defined in Eq. (D.4). The right panel shows a first row of the matrix, which is assumed to be Toeplitz. In both panels, solid lines show the result derived for the noise spectrum as in Eq. (19)without applying any apodization. Dashed lines show the results when the apodization is applied with the kernel length, λT, assuming values, 104,2000,500 and 100, as shown bottom-up, in the left panel, and right-to-left in the right panel. Dash-dot-dash lines in the left panel show the characteristic frequency at which the apodized spectrum deflects from the original one for each apodization length. This frequency is given by fdefl = 1 /πλTtsamp.
Current usage metrics show cumulative count of Article Views (full-text article views including HTML views, PDF and ePub downloads, according to the available data) and Abstracts Views on Vision4Press platform.
Data correspond to usage on the plateform after 2015. The current usage metrics is available 48-96 hours after online publication and is updated daily on week days.
Initial download of the metrics may take a while.