Fig. C.1
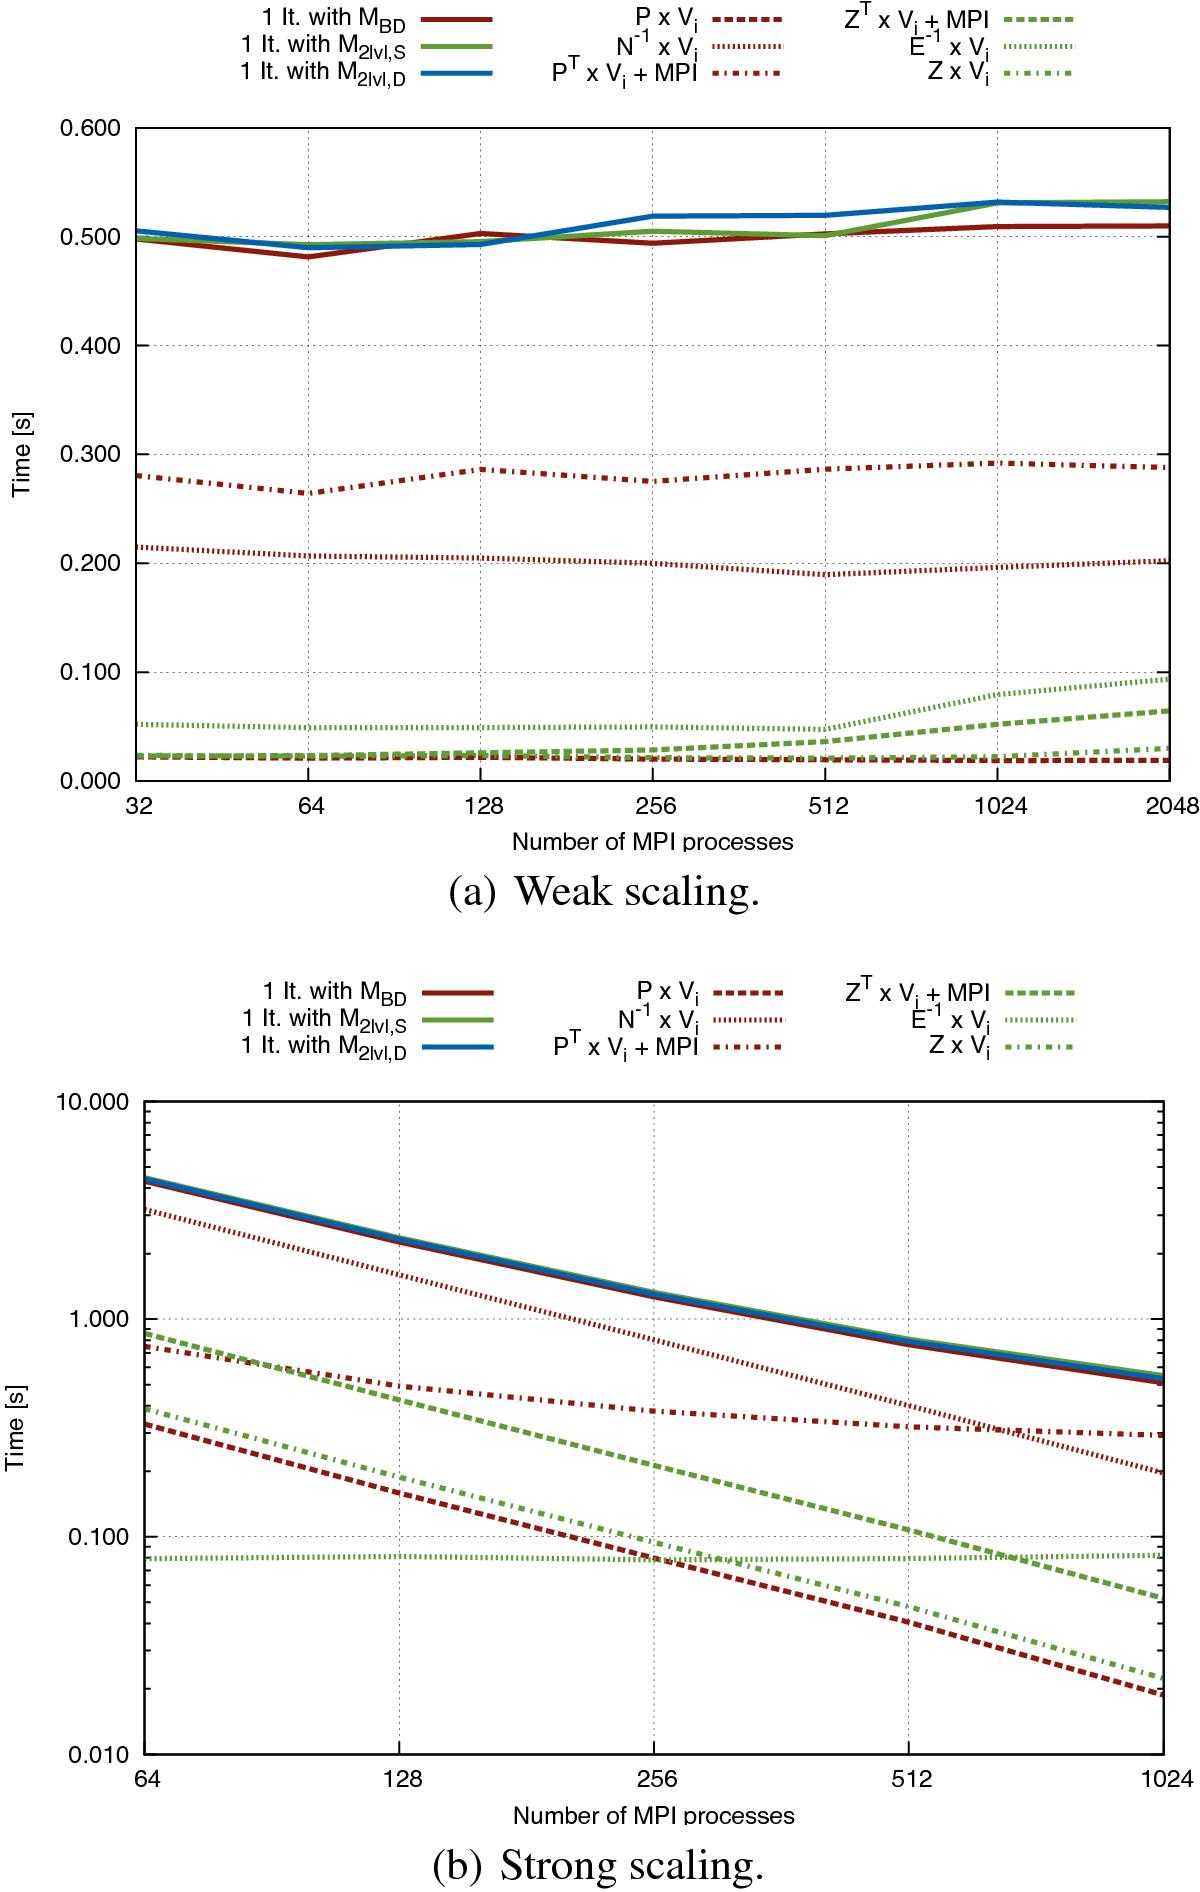
Average time per iteration and its breakdown between different operations shown as a function of the number of MPI processes. The former is shown for all three preconditioners with solid lines of different colours. The latter is shown for the a priori two-level preconsitioner only. However, the time breakdown for the a posteriori preconditioner has been found to be essentially the same in this specific experiment.
Current usage metrics show cumulative count of Article Views (full-text article views including HTML views, PDF and ePub downloads, according to the available data) and Abstracts Views on Vision4Press platform.
Data correspond to usage on the plateform after 2015. The current usage metrics is available 48-96 hours after online publication and is updated daily on week days.
Initial download of the metrics may take a while.