Fig. 8
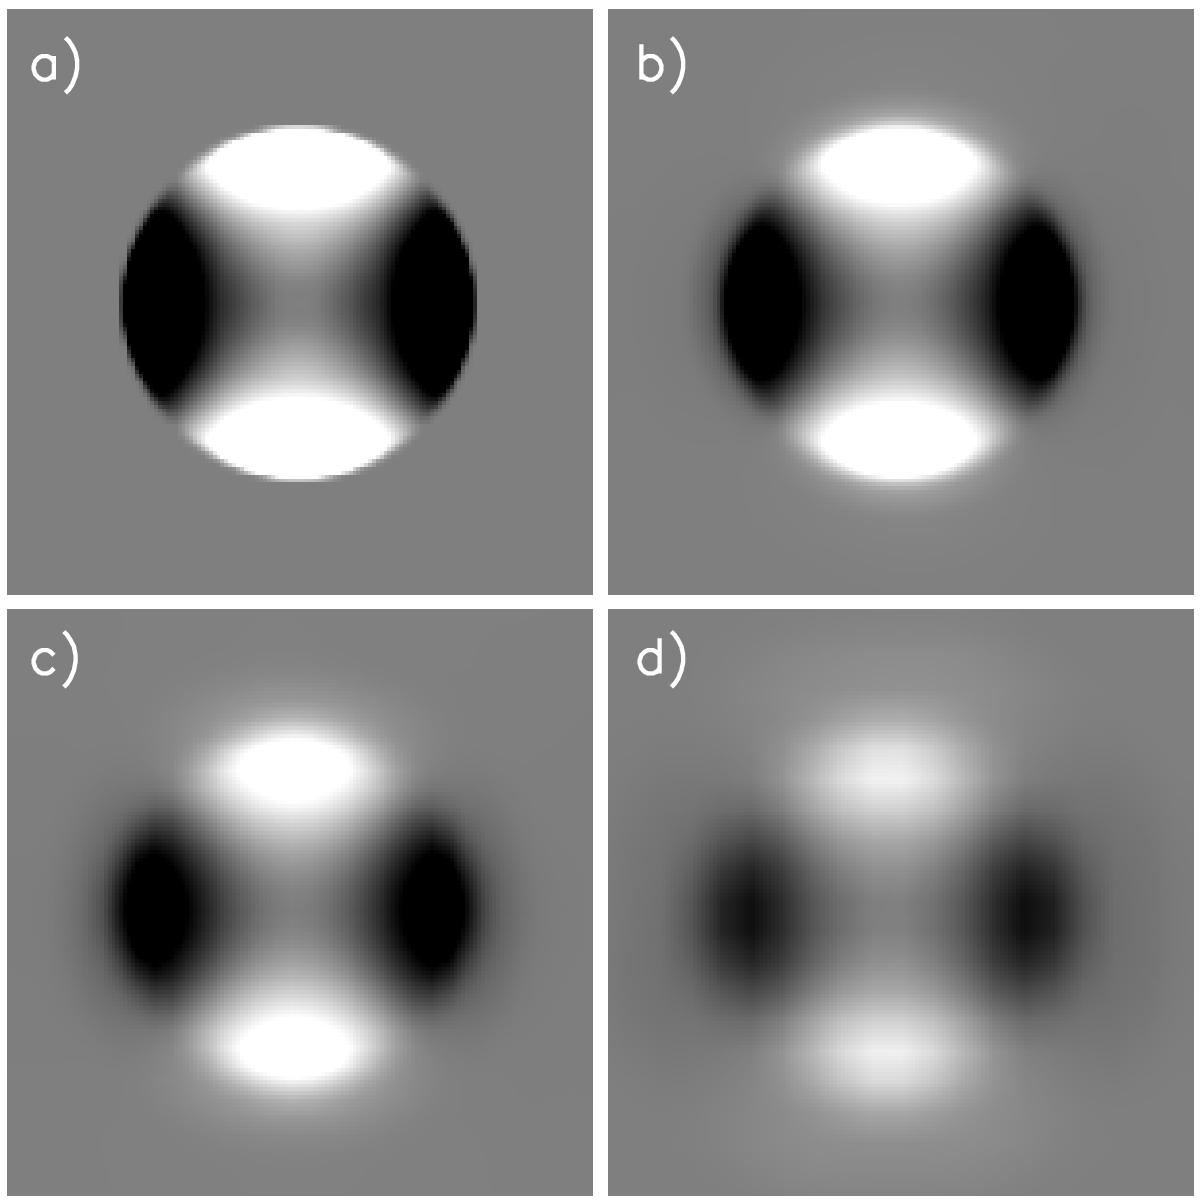
Modeling of the degradation of the Titan polarization Q due to the cancelation of opposite polarization components + Q and −Q caused by the limited resolution; a) unlimited resolution; b) HST PSF at 630 nm (F625W); c) HST PSF at 1 μm (NIC1); and d) HST PSF at 2 μm (NIC2). The gray scale spans for all panels the range from −2% (black) to + 2% (white) of the peak intensity of the initial perfect intensity image.
Current usage metrics show cumulative count of Article Views (full-text article views including HTML views, PDF and ePub downloads, according to the available data) and Abstracts Views on Vision4Press platform.
Data correspond to usage on the plateform after 2015. The current usage metrics is available 48-96 hours after online publication and is updated daily on week days.
Initial download of the metrics may take a while.