Free Access
Fig. 2
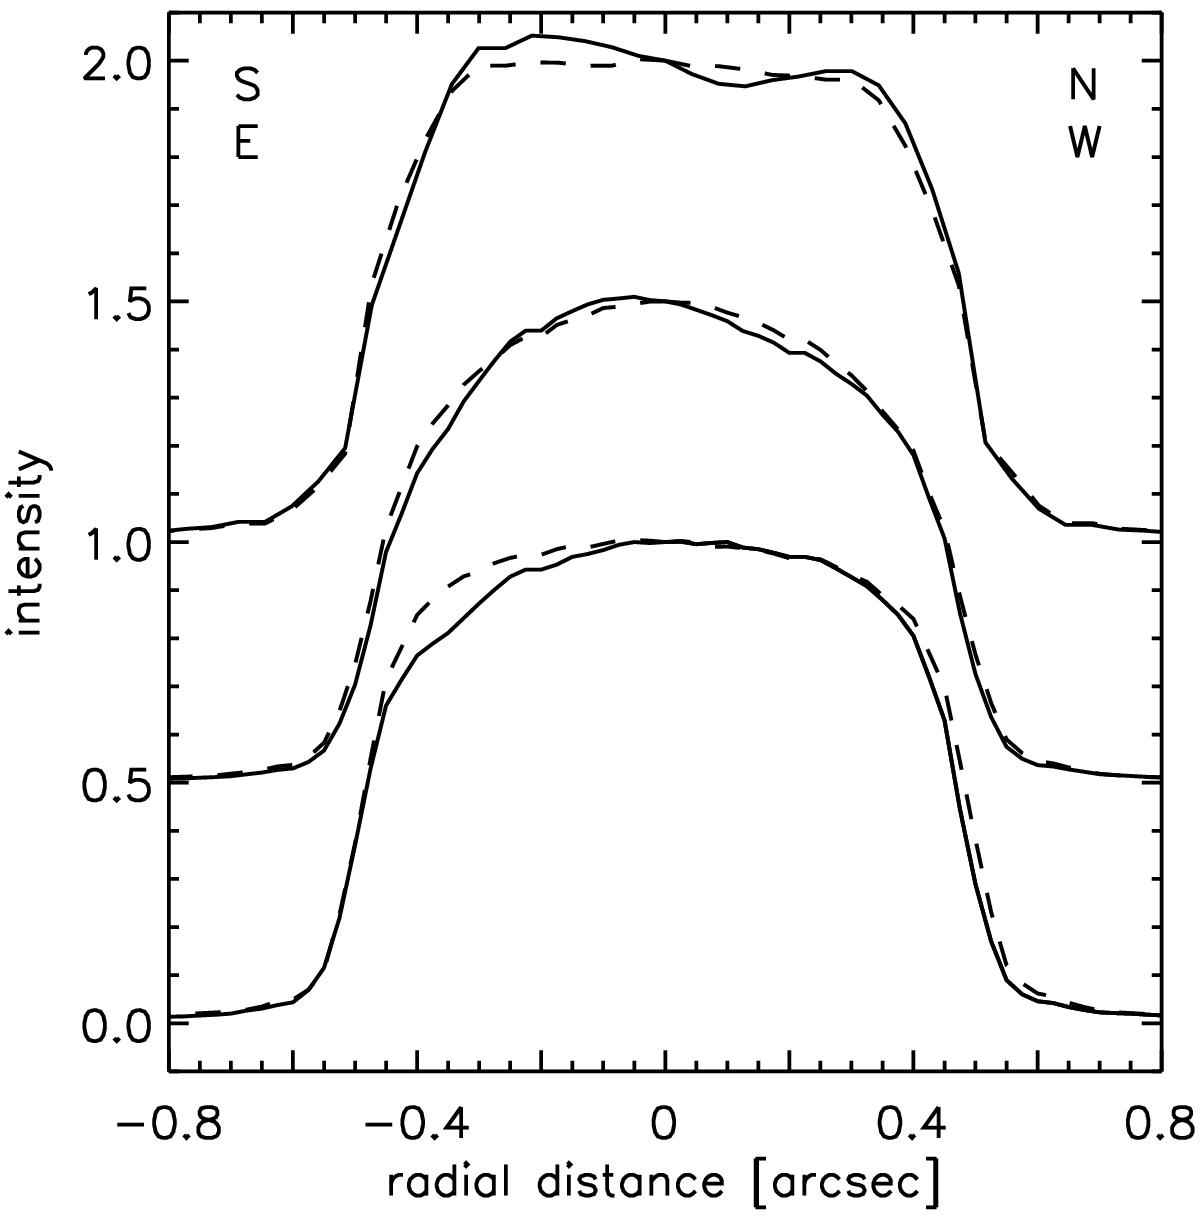
Intensity cuts/profiles through the disk center for the F250W band (bottom), the F435W band (middle), and the NIC1 band (top). The solid line indicates the north-south profile through the planetary poles, and the dashed line is the east-west profile perpendicular to the polar axis respectively.
Current usage metrics show cumulative count of Article Views (full-text article views including HTML views, PDF and ePub downloads, according to the available data) and Abstracts Views on Vision4Press platform.
Data correspond to usage on the plateform after 2015. The current usage metrics is available 48-96 hours after online publication and is updated daily on week days.
Initial download of the metrics may take a while.