| Issue |
A&A
Volume 572, December 2014
|
|
|---|---|---|
| Article Number | C2 | |
| Number of page(s) | 2 | |
| Section | Cosmology (including clusters of galaxies) | |
| DOI | https://doi.org/10.1051/0004-6361/201321150e | |
| Published online | 04 December 2014 | |
Detecting the integrated Sachs-Wolfe effect with stacked voids (Corrigendum)
1 Institut de Recherche en Astrophysique et Planétologie, 14 avenue Édouard Belin, 31400 Toulouse, France
e-mail: This email address is being protected from spambots. You need JavaScript enabled to view it.
2 Institut d’Astrophysique Spatiale, Université Paris-Sud, UMR8617, 91405 Orsay, France
3 CNRS, 91405 Orsay, France
Key words: cosmic background radiation / dark energy / large-scale structure of Universe / errata, addenda
In our original publication (Ilić et al. 2013), we incorrectly assumed that the voids radii of the publicly available catalogue of Granett et al. (2008) were given in Mpc units, while they actually are provided in units of Mpc h-1. As a consequence, Figs. 1 and 12 of our original paper should be replaced by the ones shown in the present corrigendum (Figs. 1 and 2). Another small mistake was corrected in Fig. 1 where we used the comoving radius of some voids from the Sutter et al. (2012) catalogue instead of their proper radius.
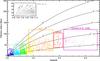 |
Fig. 1 Effective radii (in Mpc) as a function of redshift for all the voids used in this work. The two catalogues of Granett et al. (2008) and Pan et al. (2012), and the six subsamples of Sutter et al. (2012) are delimited by boxes labelled by their names. The black curves are here to indicate the angular size (in degrees) of a structure in the redshift-radius plane. |
Using the correct radii, the discrepancy between the most significant photometry scale and the size of the voids is less pronounced: the scale of the signal is comprised between 0.7 and 0.9 times the typical size of the voids. The significance of the signal itself does not change significantly and the rest of our discussion remains valid, notably concerning the peculiar features of this signal.
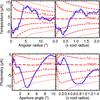 |
Fig. 2 Temperature (top) and photometry (bottom) profiles for the original (left) and rescaled (right) stacking of Gr08 voids (same conventions as Fig. 7 of our original publication). |
References
- Granett, B. R., Neyrinck, M. C., & Szapudi, I. 2008, ApJ, 683, L99 [NASA ADS] [CrossRef] [Google Scholar]
- Ilić, S., Langer, M., & Douspis, M. 2013, A&A, 556, A51 [NASA ADS] [CrossRef] [EDP Sciences] [Google Scholar]
- Pan, D. C., Vogeley, M. S., Hoyle, F., Choi, Y.-Y., & Park, C. 2012, MNRAS, 421, 926 [NASA ADS] [CrossRef] [Google Scholar]
- Sutter, P. M., Lavaux, G., Wandelt, B. D., & Weinberg, D. H. 2012, ApJ, 761, 44 [NASA ADS] [CrossRef] [Google Scholar]
© ESO, 2014
All Figures
|
Fig. 1 Effective radii (in Mpc) as a function of redshift for all the voids used in this work. The two catalogues of Granett et al. (2008) and Pan et al. (2012), and the six subsamples of Sutter et al. (2012) are delimited by boxes labelled by their names. The black curves are here to indicate the angular size (in degrees) of a structure in the redshift-radius plane. |
| In the text | |
|
Fig. 2 Temperature (top) and photometry (bottom) profiles for the original (left) and rescaled (right) stacking of Gr08 voids (same conventions as Fig. 7 of our original publication). |
| In the text | |
Current usage metrics show cumulative count of Article Views (full-text article views including HTML views, PDF and ePub downloads, according to the available data) and Abstracts Views on Vision4Press platform.
Data correspond to usage on the plateform after 2015. The current usage metrics is available 48-96 hours after online publication and is updated daily on week days.
Initial download of the metrics may take a while.