Fig. 7
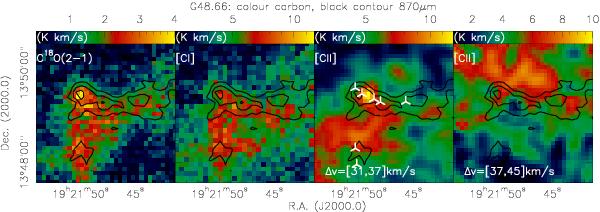
G48.66: the color scale shows from left to right the emission from C18O(2–1), [CI] and [CII], respectively. The integration ranges for C18O(2–1) and [CI] are [32.0; 35.0] and [32.0; 35.5] km s-1. The integration ranges for [CII] are marked in the 2 right panels. The contours always show the ATLASGAL 870 μm emission starting at 3σ level of 150 mJy beam-1 and continuing in 3σ steps. The white markers in the 3rd panel mark the positions of 70 μm sources.
Current usage metrics show cumulative count of Article Views (full-text article views including HTML views, PDF and ePub downloads, according to the available data) and Abstracts Views on Vision4Press platform.
Data correspond to usage on the plateform after 2015. The current usage metrics is available 48-96 hours after online publication and is updated daily on week days.
Initial download of the metrics may take a while.