Fig. 4
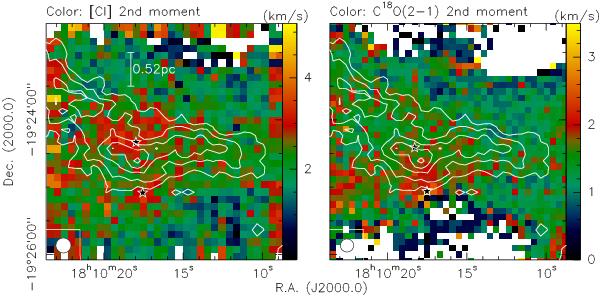
G11.11: the color scales show the 2nd moment maps (intensity weighted line widths) of [CI] and C18O(2−1) in the left and right panel, respectively. The contours present the ATLASGAL 870 μm emission with the same contours as in Fig. 2. The bottom-left of each panel shows the beam of the line data, and the left panel also presents a linear scale-bar. The five-pointed stars mark the positions toward which the spectra in Fig. 5 are extracted.
Current usage metrics show cumulative count of Article Views (full-text article views including HTML views, PDF and ePub downloads, according to the available data) and Abstracts Views on Vision4Press platform.
Data correspond to usage on the plateform after 2015. The current usage metrics is available 48-96 hours after online publication and is updated daily on week days.
Initial download of the metrics may take a while.