Fig. 2
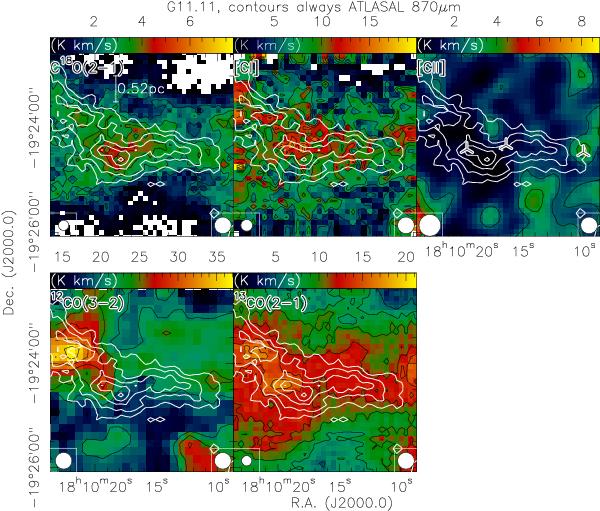
G11.11: the color scale shows integrated intensity images of the transitions marked above each panel. Integration regimes are [27, 33] km s-1, [27, 33] km s-1, [29, 31] km s-1, [24, 38] km s-1 and [24, 36] km s-1 for C18O(2−1), [CI], [CII], 12CO(3−2) and 13CO(2−1), respectively. Except for [CII], the corresponding black contours start from 15% and continue in 10% steps of the peak emission in each map. The peak values are 7.8, 19.9, 37.1 and 21.2 K km s-1, respectively. The [CII] contours start at 3σ and continue in 1σ steps of 0.8 K km s-1. The white contours always show the ATLASGAL 870 μm continuum image starting at a 3σ level of 0.15 Jy beam-1 and continue in 4σ steps. The bottom-left of each panel shows the beam of the line data whereas the bottom-right shows the continuum beam size. The three markers in the [CII] panel show the positions of 70 μm sources, and the top-left panel also shows a linear scale-bar.
Current usage metrics show cumulative count of Article Views (full-text article views including HTML views, PDF and ePub downloads, according to the available data) and Abstracts Views on Vision4Press platform.
Data correspond to usage on the plateform after 2015. The current usage metrics is available 48-96 hours after online publication and is updated daily on week days.
Initial download of the metrics may take a while.