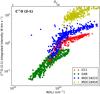
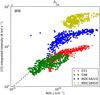
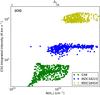
Fig. 17
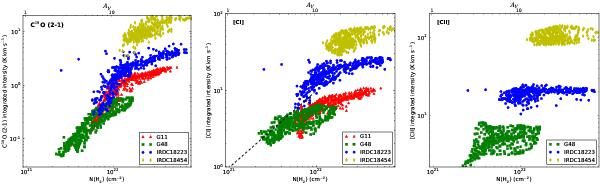
Scatter plots of the integrated C18O(2–1), [CI] and [CII] emission versus the molecular column density and extinction (in mag) derived from the Herschel far-infrared data. The color-coding separates between the different regions as marked in each panel. The integration regimes are the same as those mentioned in the previous corresponding figures (for G48.66 only the main spectral component and for IRDC 18454 only the 100 km s-1 component are used). The dashed line in the middle panel shows the fit to the modeled [CI] data from Glover et al. (2014) who fitted their data in their approximately linear regime below 10 mag extinction. For IRDC 18454, we only use the 100 km s-1 component that is clearly associated with the W43 complex.
Current usage metrics show cumulative count of Article Views (full-text article views including HTML views, PDF and ePub downloads, according to the available data) and Abstracts Views on Vision4Press platform.
Data correspond to usage on the plateform after 2015. The current usage metrics is available 48-96 hours after online publication and is updated daily on week days.
Initial download of the metrics may take a while.