Fig. 11
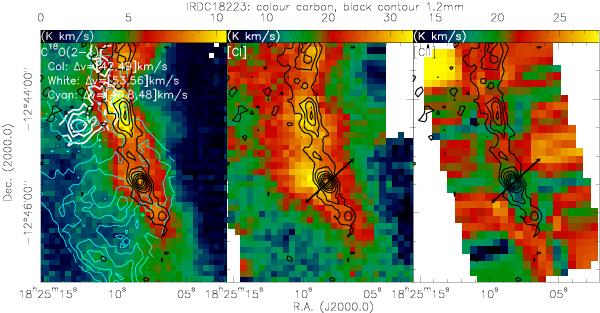
IRDC18223: the color scale shows in the left, middle and right panel the emission from C18O(2–1), [CI] and [CII], respectively. The integration regimes for the three color images are are [42; 49]. [43; 49] and [43; 55] km s-1. The white and cyan contours in the left panel correspond to the velocity components at [53.0; 56.0] and [46.9; 48.0] km s-1. The black contours always show the 1.2 mm continuum emission (Beuther et al. 2002) starting at 3σ level of 36 mJy beam-1 and continuing in 3σ steps. The arrows in the middle and right panel outline the direction of a bipolar outflow studied by Fallscheer et al. (2009).
Current usage metrics show cumulative count of Article Views (full-text article views including HTML views, PDF and ePub downloads, according to the available data) and Abstracts Views on Vision4Press platform.
Data correspond to usage on the plateform after 2015. The current usage metrics is available 48-96 hours after online publication and is updated daily on week days.
Initial download of the metrics may take a while.