Fig. 10
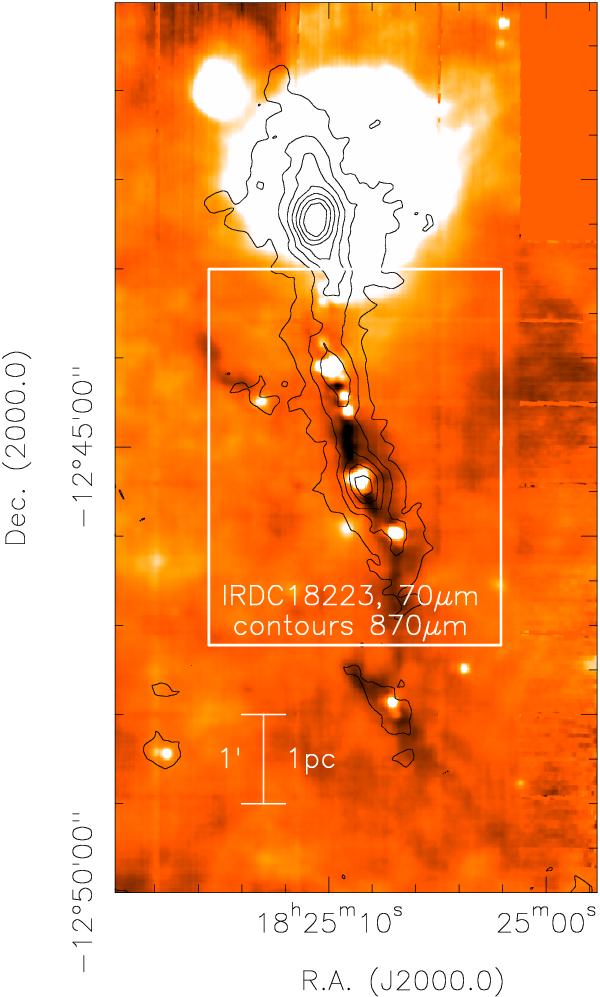
IRDC 18223: large-scale Herschel/PACS 70 μm image of the IRDC 18223 region with 870 μm ATLASGAL contours starting at 200 and continuing in 300 mJy beam-1 steps. The white box outlines the region of our carbon observations shown in Fig. 11.
Current usage metrics show cumulative count of Article Views (full-text article views including HTML views, PDF and ePub downloads, according to the available data) and Abstracts Views on Vision4Press platform.
Data correspond to usage on the plateform after 2015. The current usage metrics is available 48-96 hours after online publication and is updated daily on week days.
Initial download of the metrics may take a while.